- What Is an Ideal Customer Profile (and Why Geography Changes Everything in 2026)
- Why Google Maps Geographic Data Rewrites the ICP Playbook
- Step-by-Step: Build Your Geographic ICP Using Google Maps Data
- ICP Template for Geographic Targeting (Copy & Use)
- Real B2B Results: Companies Using Geographic ICP Targeting
- How Scrap.io Makes Geographic ICP Building Effortless
- ICP vs. Buyer Persona: What's the Difference?
- Compliance & Data Quality: Staying Legal
- FAQ
90% of startups fail because they don't truly know their customers (CB Insights, 2024). Not because their product sucks. Not because of bad timing. They just never figured out who they were selling to — and more importantly, where those people actually are.
A roofing contractor in Phoenix and a roofing contractor in Portland are not the same customer. Different climate, different regulations, different competitors breathing down their neck. Yet most B2B teams build their ideal customer profile like geography doesn't exist. Firmographics, industry, revenue — sure, fine. But that's like trying to find a restaurant by knowing it serves Italian food. In which city? On which street?
That's the gap Google Maps data fills. And in 2026, if you're not layering geographic intelligence into your ICP, you're targeting with one eye shut.
Video: How to Turn Your CRM Into a War Machine Using Google Maps Data
What Is an Ideal Customer Profile (and Why Geography Changes Everything in 2026)
ICP Definition: Beyond Firmographics
An ideal customer profile is your blueprint for the perfect account. The company that needs what you sell, can actually pay for it, and won't churn after three months. Simple enough.
But here's where most teams go wrong. They stop at the basics — industry, company size, annual revenue, tech stack. That's a skeleton without muscle. A B2B ideal customer profile built on firmographics alone misses the single biggest variable in purchasing behavior: location.
Companies with well-defined ICPs see 67% higher win rates (Gartner, 2024). And the ones seeing the best results? They're the ones who figured out that a 50-person SaaS company in Austin behaves completely differently from one in Boston. Different hiring pace, different vendor preferences, different budget cycles.
If your ICP doesn't have a geographic component, it's incomplete. Period.
Why Static Data Falls Short for B2B Targeting
Here's the problem with traditional ICP data. You buy a list. It's already three months old by the time you load it into your CRM. Businesses moved, closed, pivoted. That dental practice in Houston? Relocated to Dallas. That "startup" in your database? Acquired six weeks ago.
Real-time location intelligence outperforms static data by 45% for targeting accuracy (Location Intelligence Report, 2024). Not a small edge — nearly half-better at putting the right message in front of the right account. Static spreadsheets can't compete with what's actually happening on the ground right now.
74% of B2B buyers prefer vendors who understand their local market (B2B Buyer Survey, 2024). They want someone who gets that their city has specific regulations, that their industrial park has unique logistics, that their region's economy is booming or struggling. A generic pitch from someone who clearly doesn't know where they are? Delete.
Why Google Maps Geographic Data Rewrites the ICP Playbook
200 Million Businesses, Updated in Real-Time
Google Maps indexes roughly 200 million business establishments globally (Google, 2024). That's not some curated directory or a list someone built three years ago. It's a living, breathing map of commercial activity — updated constantly as businesses open, close, move, and change their hours.
For ICP building, this means you can answer questions that static databases simply can't. Which neighborhoods have the highest density of your target industry? Where are new businesses opening fastest? Which areas have competitors and which are wide open?
Platforms like Scrap.io give you instant access to this geographic business data — try it with a free trial and 100 leads included.
Location-Based Behavioral Insights That Spreadsheets Miss
Here's something most people overlook. Businesses in different locations behave differently. East Coast companies tend to move fast and expect quick responses. West Coast companies take more meetings before deciding. Midwest firms value relationships over flashy decks.
A 12-person marketing agency in Brooklyn has different pain points than one in Nashville. Brooklyn agency? Probably competing with 400 other agencies in a 5-mile radius, needs differentiation tools. Nashville agency? Fewer competitors, but clients are more price-sensitive, and the local economy is shifting fast.
You can't see this stuff in a spreadsheet. You see it on a map.
Geographic Clustering: The Hidden Pattern in Your Best Customers
Take your top 20% of customers — the ones with the highest LTV, lowest churn, fastest close. Map them. I guarantee you'll see clusters.
Geographic clustering analysis reduces customer acquisition costs by 23% (B2B Marketing Analysis, 2024). Why? Because when you realize your best clients concentrate in three metro areas, you stop wasting budget on the other 47 states. You go deep where the money is.
Top US regions for B2B geo-targeting right now: California, Texas, the Northeast corridor. Emerging hotspots: Denver, Nashville, Phoenix, Miami, Portland. Tech hubs like San Francisco, Austin, Seattle, and Boston still dominate — but the secondary markets are where the growth is.
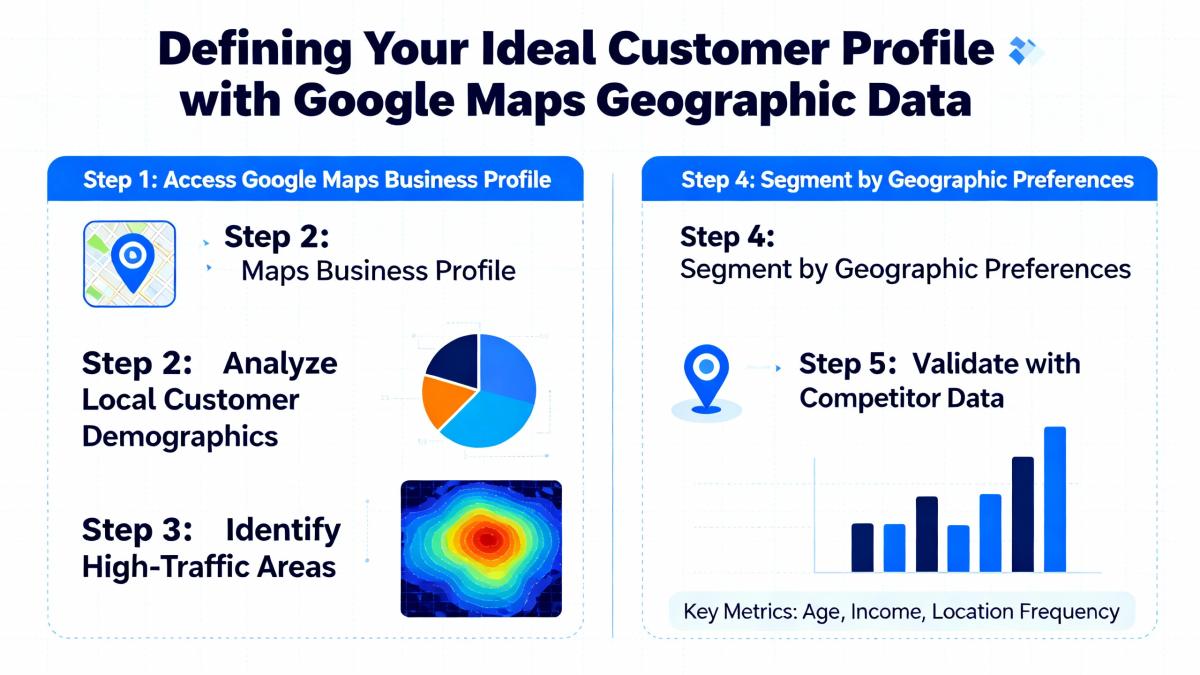
Step-by-Step: Build Your Geographic ICP Using Google Maps Data
Step 1 — Analyze Your Best Customers by Location
Pull your top customers. Not all customers — your best ones. Highest revenue, longest retention, fastest deal velocity. Now plot them on a map.
Don't just look at HQ addresses. Where do they actually operate? A company headquartered in Chicago might do 80% of its business across the Sun Belt. The HQ tells you one thing; the operational footprint tells the real story.
Look for patterns:
- Do they cluster in specific metro areas? (Most do.)
- Are they near industry-specific hubs — hospital districts, tech corridors, manufacturing zones?
- What's the local economic health where they sit?
- How far are they from your own operations? Companies focusing on leads within 50 miles report 30-40% lower CAC (Passionfruit, 2026).
Step 2 — Extract Geographic Patterns from Google Maps
This is where it gets tactical. Using tools for Google Maps scraping and data extraction, you pull real data on businesses in your target areas.
What to extract:
- Business density by category in each region
- Competitor locations (and gaps where they're absent)
- Adjacent businesses that might also need your solution
- Growth signals — new listings, recent reviews, updated hours
You want to extract emails from Google Maps for the businesses that match your geographic ICP criteria. Not random contacts. Targeted ones, in the right locations, matching your profile.
This is how to define your ideal customer profile with geographic data that's actually current. Not a report from 2023. Data from this week.
Step 3 — Identify High-Value Geographic Clusters
Once you've got the data, the clusters become obvious. Five plumbing companies in your top-10 clients are all in the Dallas-Fort Worth metro? That's a cluster. Eight of your best SaaS clients sit within 20 miles of each other near Austin? That's not a coincidence — it's a pattern.
93% of B2B companies run regional campaigns (Passionfruit, 2026). The smart ones let the data pick the regions for them.
Geographic clustering reveals things firmographics hide. You might discover that your ideal customer isn't "50-200 person tech companies" — it's "50-200 person tech companies located within 10 miles of a major university." The geography is the qualifier that separates good leads from great ones.
Step 4 — Validate with Local Market Conditions
Found your clusters? Good. Now stress-test them. Not every cluster is worth pursuing.
Check:
- Local economic health: Is the area growing or contracting?
- Regulatory environment: Different states, different rules. A compliance product sells differently in California vs. Texas.
- Competitive density: Are there already 10 vendors serving that cluster? Or are you the first to notice it?
- Talent availability: Businesses in areas with tight labor markets have different priorities.
Talk to a few prospects in each cluster. (A quick outreach campaign works.) If 3 out of 10 respond positively, you've validated the cluster. If crickets — move on.
Step 5 — Build Your Geographic ICP Template
Now assemble everything into a document your team can actually use. (I'll give you the template in the next section.)
The key: your geographic ICP should be specific enough to filter prospects, but flexible enough to evolve. Markets shift. A cluster that was gold in Q1 might cool off by Q4. Build in quarterly reviews.
ICP Template for Geographic Targeting (Copy & Use)
Essential Geographic Firmographics
Here's what your ideal customer profile template should include for geographic targeting:
| Category | Data Points |
|---|---|
| Location | HQ address, operational regions, proximity to industry hubs, distance from major transport |
| Market context | Local market size, growth rate, economic indicators, regulatory environment |
| Competitive landscape | Number of competitors in area, market saturation level, vendor switching behavior |
| Cluster membership | Part of an industry cluster? Near a university? In a tech corridor? |
| Behavioral signals | Local review ratings, website presence, recent Google Maps updates, hiring activity |
Location-Based Behavioral Indicators
Buying behavior varies by geography more than most teams realize:
- Decision speed: Northeast = fast. West Coast = deliberate. Midwest = relationship-first.
- Budget cycles: Vary by region, industry concentration, and local fiscal years.
- Communication preferences: Some regions prefer calls; others want everything over email.
- Tech adoption: San Francisco adopts new tools in weeks. Rural markets might take 18 months.
Your CRM automation with Google Maps data setup should tag each lead with these geographic behavioral indicators. That way, your sales team adjusts their approach before the first outreach — not after three ignored emails.
Regional Market Considerations
Don't forget the macro layer. If you're targeting the US:
- California: massive market, high competition, heavy regulation
- Texas: business-friendly, fast growth, lower density outside major metros
- Northeast corridor (NY/NJ/CT/MA): high density, sophisticated buyers, budget-conscious
- Southeast (FL/GA/NC): emerging tech scenes, lower CAC, relationship-driven sales
- Pacific Northwest (WA/OR): tech-forward, sustainability-conscious, methodical decision-making
For a more detailed comparison of lead sources, see Google Maps vs Facebook for B2B lead generation.
Real B2B Results: Companies Using Geographic ICP Targeting
Case Study Highlights
First Databank (FDB) — pharmaceutical information provider. They ditched rented broad lists and switched to segmented targeting by organization type (hospitals, clinics) and geography. Result: 300% ROI (4:1 ratio), 13.4% appointment conversion rate, 15.9% of those appointments converted to clients (MarketingSherpa).
SaaS Company via UnboundB2B — used an ABM approach with geographic and firmographic segmentation for a 12-week campaign. Result: 227% ROI growth via email + telemarketing BANT-qualified leads (UnboundB2B Case Study).
Austin M., marketing agency (51-200 employees) — used geographic Google Maps data to refine their ICP. Discovered their best clients cluster in specific tech hubs. Outcome: +40% in qualified leads after integrating geographic data.
Geo-targeted B2B benchmark — companies running location-based campaigns saw +40% new leads in under-penetrated markets, -18% cost per lead, and +50% webinar participation with localized outreach (Passionfruit).
What the Data Says
The numbers pile up fast. Companies using geographic segmentation see 2-3× better ROI on marketing spend vs. broad national campaigns (Passionfruit, 2026). Segmented email campaigns generate 30% more opens and 50% more click-throughs (Sopro, 2026). And hyper-targeted campaigns (under 50 recipients) hit a 5.8% reply rate versus 2.1% for campaigns over 1,000 recipients.
Want to see which businesses cluster near your best customers? Start with 100 free leads on Scrap.io and test geographic targeting yourself.
How Scrap.io Makes Geographic ICP Building Effortless
Real-Time Google Maps Data at Scale
Scrap.io pulls live data from Google Maps — business names, addresses, phone numbers, emails, ratings, reviews, categories. All current, all verified against what's actually listed right now. No stale data from a database that hasn't been updated since last year.
You search for a business category + location, and you get every matching business with full contact details. For AI-powered cold email personalization for local businesses, this is the starting dataset that makes everything else work.
Advanced Filtering for Precision Targeting
The filters are where it gets surgical. Want only businesses with fewer than 10 reviews (newer companies, possibly under-served)? Done. Only businesses without a website (they need your web design services)? Done. Only businesses with a rating below 3.5 (they might need your reputation management tool)? Done.
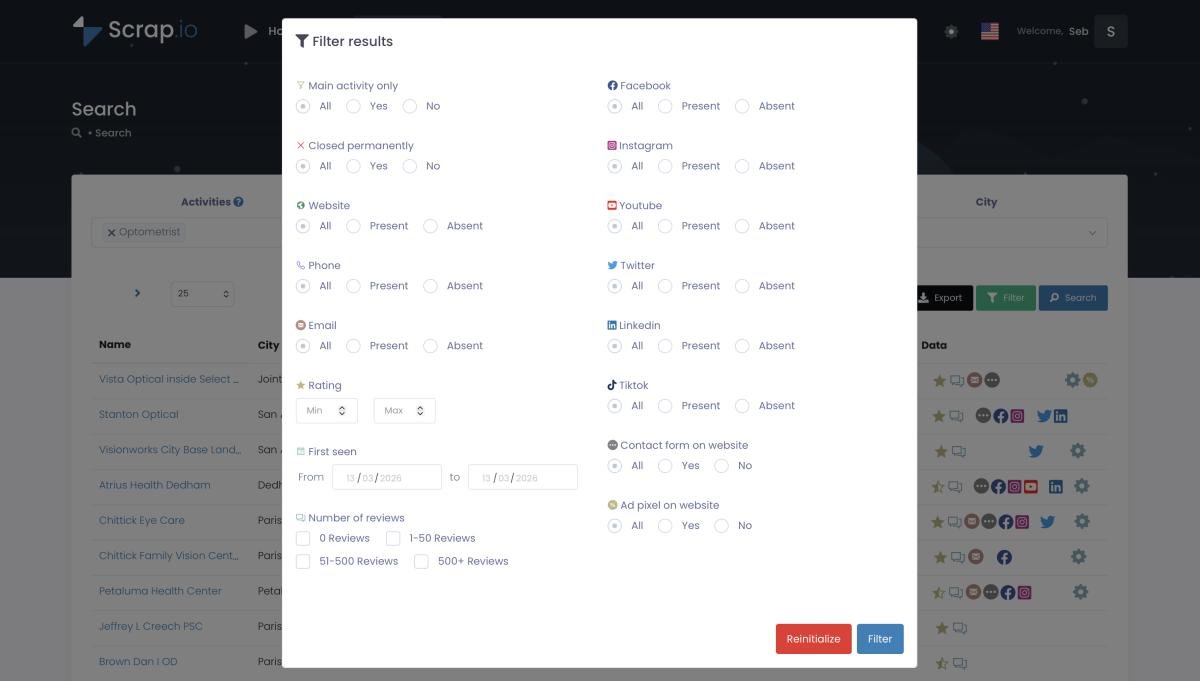
You're not building an ideal customer profile from theory. You're building it from the actual businesses sitting on Google Maps right now.
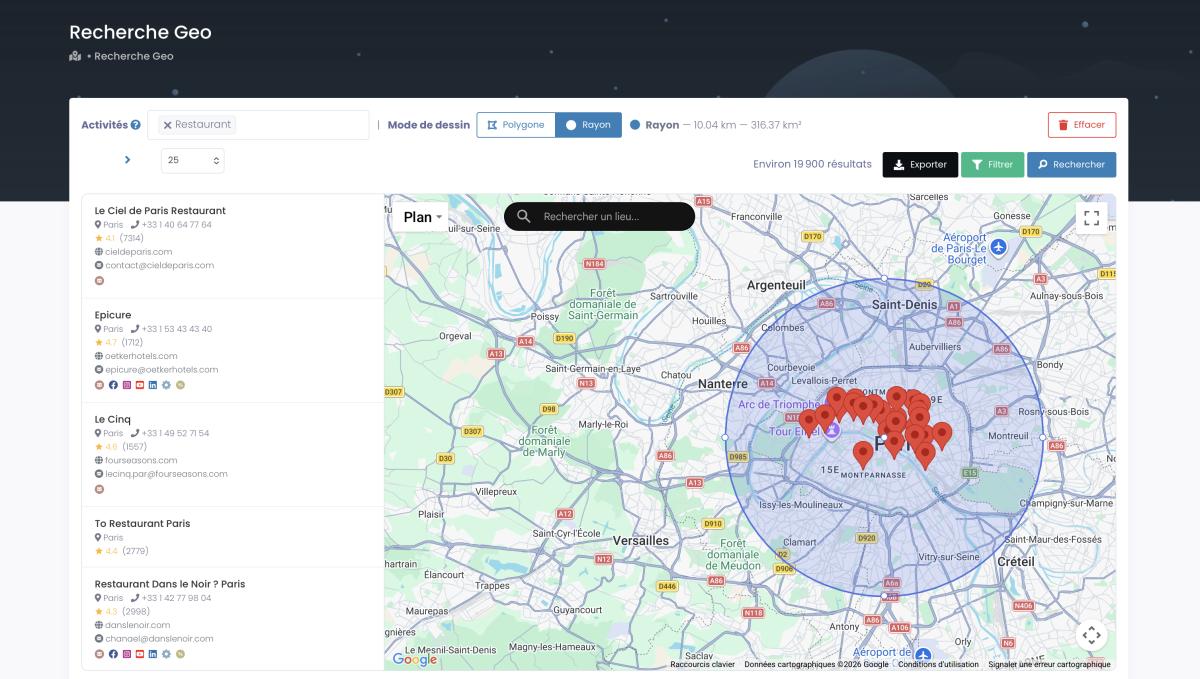
GeoSearch: Target by Radius or Custom Polygon
GeoSearch is the feature that makes geographic ICP targeting practical. Drop a pin, set a radius (say, 25 miles around your best customer cluster), and Scrap.io returns every matching business inside that circle.
Or draw a custom polygon — maybe you want every dentist in downtown Chicago but not the suburbs. The polygon lets you carve out exactly the geography you need.
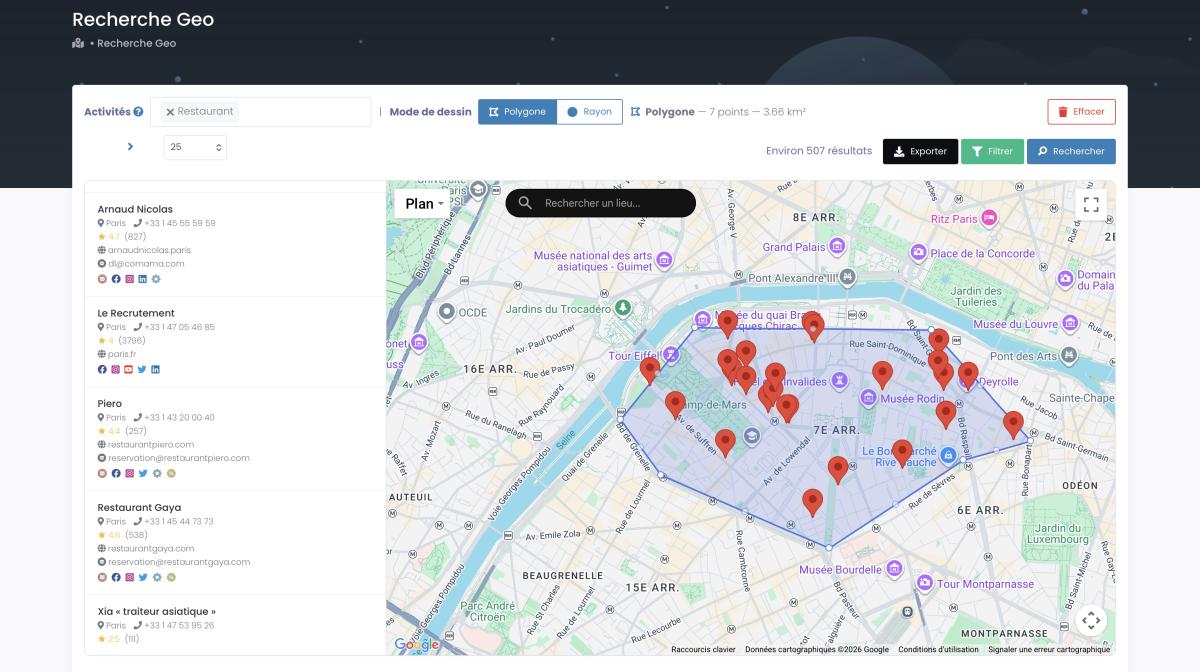
This kind of proximity-based targeting was straight-up impossible three years ago without a GIS team and six figures in software licenses.
ICP vs. Buyer Persona: What's the Difference?
People mix these up constantly. Quick distinction.
Your ideal customer profile describes the company — the account. Industry, size, revenue, location, tech stack, behavioral signals. It's who you sell to at the organizational level.
A buyer persona describes the person inside that company. Their job title, goals, frustrations, how they make decisions, what keeps them up at night.
You need both. But ICP comes first. There's no point building a detailed persona for the VP of Marketing at a 200-person SaaS company if that SaaS company is in a market you can't serve. The ICP filters the accounts; the persona guides the conversation once you're in.
For a deeper dive, What Is ICP in Sales covers the general framework. This article focuses specifically on adding geographic data to make that ICP sharper.
Compliance & Data Quality: Staying Legal
Let's talk about the elephant in the room. Scraping Google Maps data — is it legal?
Short answer: the data on Google Maps is publicly available information that businesses voluntarily publish. Extracting it for B2B prospecting purposes is widely practiced and legally defensible in most jurisdictions.
That said, you still need to follow the rules when you use that data:
- CAN-SPAM (US): Every cold email needs a physical address, opt-out mechanism, and honest subject line. Non-negotiable.
- GDPR (EU): If you're targeting European businesses, you need a legitimate interest basis and must honor data subject requests. (The good news: B2B contact data for professional purposes generally falls under legitimate interest.)
- CCPA (California): Similar to GDPR but lighter. Still requires opt-out honoring.
Data quality matters more than data quantity. One hundred verified, geographically targeted leads will outperform ten thousand random contacts every single time. That's the entire point of geographic ICP targeting — precision over volume.
FAQ
What is a geographic data-driven ICP and how is it different from a traditional ICP?
A geographic ICP adds real-time location data — business clustering patterns, regional market conditions, proximity to industry hubs — to standard firmographic criteria. Traditional ICPs rely on demographics and firmographics alone, which gives you maybe 60% of the picture. Adding geography bumps targeting accuracy by 45% compared to demographics-only approaches (Location Intelligence Report, 2024). It's the difference between "we sell to mid-size tech companies" and "we sell to mid-size tech companies within 15 miles of a major university in the Sun Belt."
How often should I update my geographic ICP data?
Monthly refresh cycles for the data itself — businesses relocate, new ones open, others close. Quarterly strategic reviews to reassess whether your geographic clusters still hold. Markets shift, and a hot cluster in Q1 might cool by Q3. Most B2B SaaS companies see early improvements in lead quality within 4-6 weeks of using data-driven ICP targeting, with larger CAC reductions appearing after 8-12 weeks (SaaS Hero Research).
Can small businesses benefit from geographic ICP targeting?
More than big ones, honestly. A small business with a limited budget has to be precise about where it prospects. Geographic focus means you're not wasting money on leads three time zones away who'll never convert. Companies focusing on leads within 50 miles of their operations report 30-40% lower customer acquisition costs (Passionfruit, 2026). For a 5-person agency, that's the difference between profitable growth and burning cash.
What geographic factors should I include in a B2B ICP?
The core list: business clustering patterns, industry hub proximity, transportation accessibility, local economic health indicators, competitive density, regulatory environment, and regional business culture. Don't overlook less obvious factors — proximity to universities (talent and innovation), proximity to airports (international business), and even local cost of living (affects pricing sensitivity).
How do I measure the success of a geographic ICP?
Five metrics: regional conversion rates (which clusters convert best?), location-specific customer acquisition costs (where is it cheapest to acquire?), geographic customer lifetime value (where do customers stick longest?), territory-specific sales cycle length (where do deals close fastest?), and market penetration percentage by region (where can you still grow?). Compare these across your geographic clusters quarterly.
Try Scrap.io with a free trial — get 100 verified business leads with full geographic data instantly. Start your free trial →
Ready to generate leads from Google Maps?
Try Scrap.io for free for 7 days.