Video: How Google Maps Became a Lead Gold Mine
- Why Local Prospecting KPIs Matter in 2026
- Lead Generation & Qualification KPIs (1-7)
- Customer Acquisition & Cost KPIs (8-14)
- Operational & Performance KPIs (15-20)
- Industry Benchmarks for Local Prospecting (2026)
- How to Track These KPIs with Google Maps Data
- Common Mistakes When Measuring Local Prospecting
- KPI Dashboard Template for Google Maps Prospecting
- FAQ
The median B2B cost per lead hit $213 in 2026. Two hundred and thirteen dollars. Per lead. That's according to HubSpot's State of Marketing report, and it climbed 11% from last year alone.
Not tracking your local prospecting KPIs? That's $213 per guess.
Let that sink in.
I talk to sales teams every week who are pouring money into prospecting with zero visibility on what's actually working. They'll tell me they're "doing great" because they made 200 calls. Cool. How many turned into customers? Blank stare. That's the equivalent of celebrating how many times you swung the bat without checking if anything landed in the outfield.
Why Local Prospecting KPIs Matter in 2026
Here's what changed. 79.2% of marketing teams expect their budgets to increase this year (HubSpot, 2026). More money flowing in. But more money doesn't fix a targeting problem — it amplifies it. Throw cash at bad prospecting metrics and you just burn faster.
And local prospecting? Completely different beast from generic B2B. Your local business prospecting metrics 2026 look nothing like enterprise SaaS. A dentist in Phoenix doesn't behave like a startup in San Francisco. The buying cycle is shorter. The decision-maker IS the owner. The trust signals are reviews and proximity, not whitepapers and webinars.
Look at Clay. They went from $1M to $100M ARR in two years — largely by helping teams weaponize Google Maps data for prospecting. That kind of growth doesn't happen because somebody got lucky. It happens because the market was starving for better sales prospecting KPIs tied to real local data.
Google Maps indexes over 225 million establishments across 195 countries. That's not a database. That's an ocean. And without the right KPIs, you're fishing in it blindfolded.
Bref. Twenty KPIs. That's what separates teams printing money from teams burning it. Let's go.
Lead Generation & Qualification KPIs (1-7)
Lead Volume Metrics (KPIs 1-3)
KPI #1: Total Local Leads Generated
How many businesses are you actually finding per campaign? This is your baseline — one of the best KPIs for google maps lead generation because it forces you to quantify effort. If you can't answer with a number, everything else is irrelevant.
Cameron Figgins at Absolute Maintenance generates 100-150 businesses within 5-8 miles of his target zone. Then he buckets them by year built, exterior appearance, reviews, and category. That's not spraying and praying — that's surgical volume with built-in qualification.
KPI #2: Lead Source Distribution
Where are your leads coming from? Google Maps category searches, geographic sweeps, review-based targeting, competitor analysis? Track each channel separately. A lead from a "restaurants with bad reviews" search converts wildly different from a "all businesses in downtown Austin" dump.
KPI #3: Geographic Coverage Rate
What percentage of your target territory have you actually prospected? Most teams think they've covered 80%. Reality? Closer to 25-30%. Whole neighborhoods sitting untouched. With tools like Scrap.io's GeoSearch, you can draw a radius on a map and extract every business inside it — then actually see the gaps.
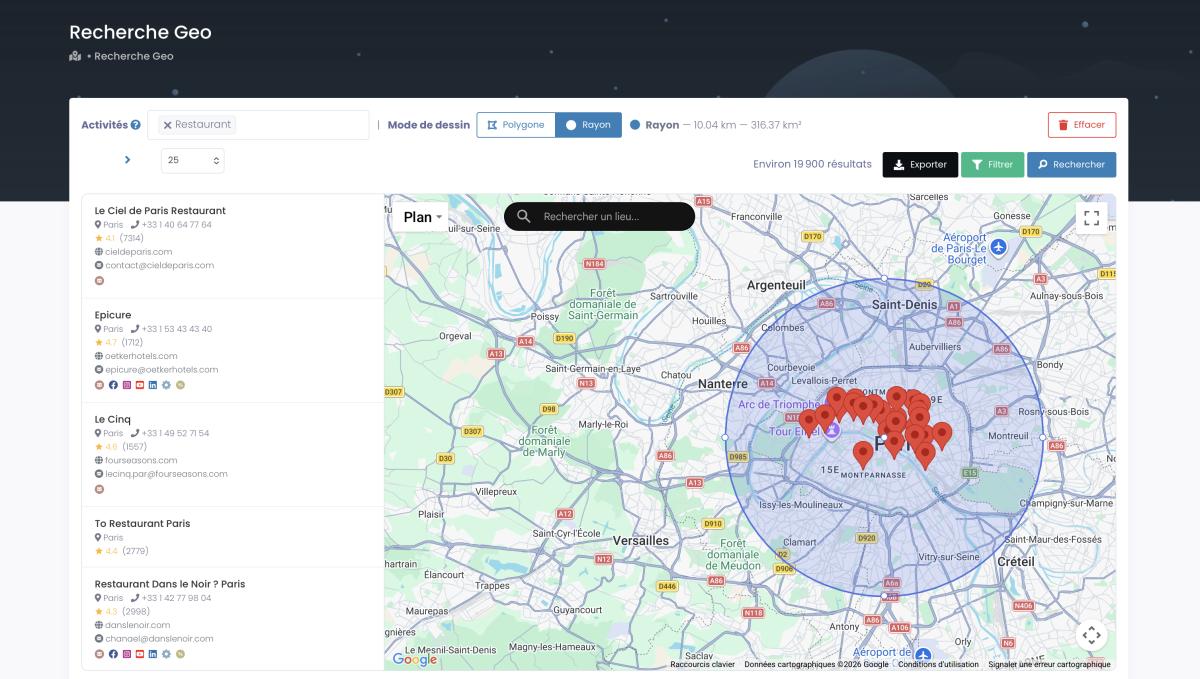
Define your prospecting radius on the map. Scrap.io's GeoSearch lets you target any area with precision.
Lead Quality Indicators (KPIs 4-6)
KPI #4: Lead Scoring Accuracy
Can your scoring model actually predict who buys? Professional services firms hit 9.3% conversion when lead scoring is dialed in. Without it? You're treating a 5-star restaurant and a 2-star pizza joint like they're the same opportunity. They're not. (And if your lead scoring for local leads still doesn't factor in Google reviews, you're leaving money everywhere.)
KPI #5: Data Freshness Score
Old data is poison. A 90-day-old business database? Already 25% wrong. Phone numbers disconnected. Emails bouncing. Businesses closed. Google Maps data pulled in real time doesn't have this problem — Scrap.io's 225M+ establishments are refreshed at extraction, not cached from some spreadsheet last updated when people still used Clubhouse.
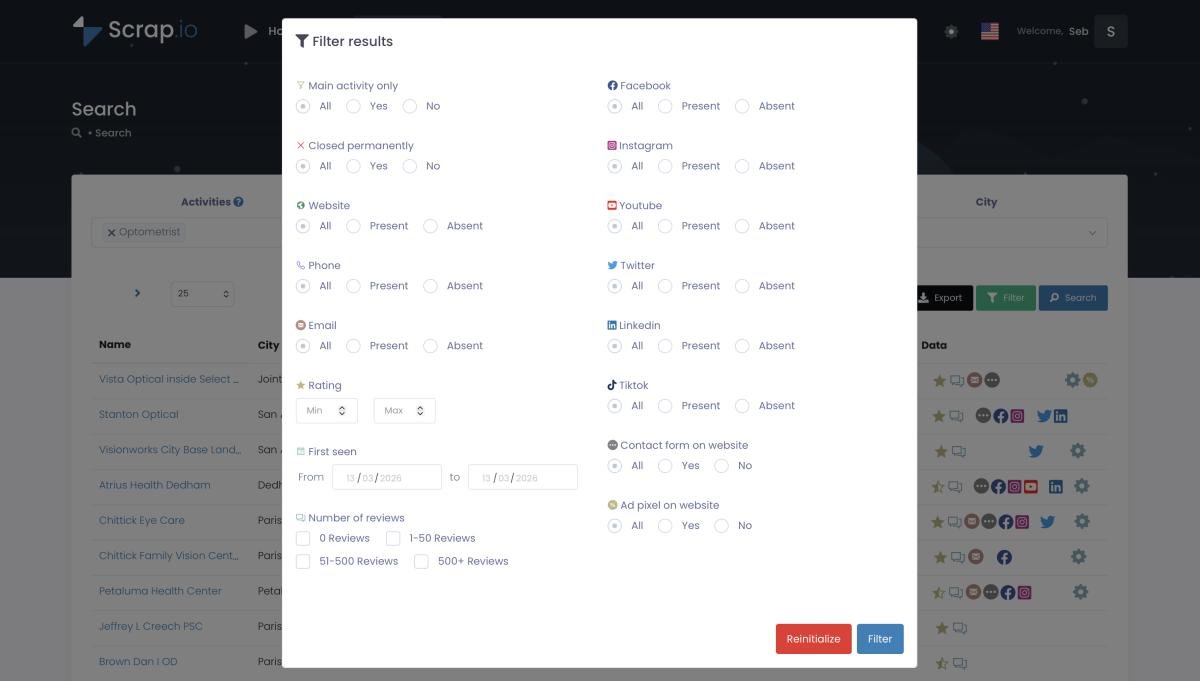
Scrap.io's filters let you qualify leads BEFORE extraction — only pay for contacts with verified emails, mobile numbers, or specific review scores.
KPI #6: Contact Information Completeness
What percentage of your leads have a real email (not info@), a working phone number, active social profiles, and a live website?
This single metric predicts outreach success better than almost anything else. Incomplete contacts = wasted sequences.
Conversion Tracking (KPI 7)
KPI #7: Lead-to-Opportunity Conversion Rate
The big one. Your lead conversion rate local prospecting benchmark is 10-15% for B2B. HubSpot's 2026 data puts the average MQL-to-SQL rate at 9.8% across industries. But here's what kills me — respond within 5 minutes and conversions jump 9x. Nine times. Not nine percent. Nine times more likely to convert.
And yet most teams wait hours. Days, even. By the time you call back, that business owner already hired your competitor. They were ready to buy RIGHT NOW. You just weren't there.
Track this metric obsessively. Build your entire sales pipeline around shortening the gap between "lead captured" and "first contact."
Customer Acquisition & Cost KPIs (8-14)
Most teams celebrate dropping their CPL to $100. Smart teams ask a different question: what's that lead worth over 3 years?
Cost-Related Metrics (KPIs 8-11)
KPI #8: Cost Per Lead (CPL)
The metric everyone tracks but almost nobody tracks correctly. You need CPL by channel, by territory, and by lead source. A blended CPL is useless — it hides the fact that your LinkedIn ads cost $200/lead while your Google Maps extraction costs pennies.
| Industry | Avg. Paid CPL | Avg. Organic CPL |
|---|---|---|
| B2B SaaS | $341 | $205 |
| Legal Services | $1,245 | ~$750 |
| Real Estate | $1,185 | ~$700 |
| Construction | $281 | ~$170 |
| Health & Beauty | $127 | ~$75 |
| Google Maps Data | ~$0.002/lead via Scrap.io | |
Sources: First Page Sage, HubSpot — 2025/2026 data
Look at that last row. Then look at legal services. And people wonder why a roofing contractor went from $2M to $8M revenue in 18 months just by switching from door-knocking to a structured Google Maps pipeline. (That's a real case, documented on industry blogs. The math isn't complicated — cheaper leads with better cost per lead google maps data = more budget for closing.)
KPI #9: Customer Acquisition Cost (CAC)
Everything. Ads, salaries, tools, that CRM nobody uses properly, the coffee machine in the sales bullpen. Your customer acquisition cost local leads calculation needs ALL of it, divided by new customers. The full CAC formula and 2026 benchmarks are worth studying — because CAC keeps climbing while most teams aren't even calculating it correctly.
KPI #10: Cost Per Qualified Lead
Not just any lead. Good ones. A marketing agency finding restaurants without websites? Their cost per qualified lead drops in half compared to spray-and-pray campaigns. Filter BEFORE you extract. Only spend credits on contacts with verified emails. Scrap.io does this natively — zero wasted credits on junk.
KPI #11: Channel Cost Efficiency
Cold calling (97% ignore you — brutal). Email. Social. Direct mail. Each channel has wildly different economics. Track ROI per channel, not just activity. One channel at $5/lead that converts at 8% beats another at $2/lead that converts at 0.5%. Every time.
Revenue & Value KPIs (KPIs 12-14)
KPI #12: Average Deal Size
A dentist might drop $50,000 over two years. A coffee shop? $5,000 tops. Know who you're targeting and adjust your KPIs accordingly. Chasing small deals with enterprise-level outreach is how agencies go broke.
KPI #13: Customer Lifetime Value (CLV)
Huge. If a local HVAC company is worth $80,000 over five years, spending $500 to acquire them is a steal. Spending $500 on a lead worth $2,000? Suicide. CLV for local B2B prospecting is the lens that makes every other metric make sense.
KPI #14: CLV to CAC Ratio
3:1 minimum. Spend $1,000 to acquire a customer, get $3,000 back. Below 2:1? You're losing money. Above 6:1? You're probably underinvesting in growth. The sweet spot is 3:1 to 5:1 for CLV to CAC ratio B2B prospecting. Anything else means something's off.
Operational & Performance KPIs (15-20)
Your rep answered in 47 minutes. Guess what? That lead already scheduled a demo with your competitor. Speed kills in local prospecting. Or rather, lack of speed kills your pipeline.
KPI #15: First Response Time
Under 5 minutes. That's not aspirational — it's the baseline. The response time impact on lead conversion is savage: respond in 5 minutes and you're 9x more likely to connect. Wait an hour? Drop to roughly 1x. The math is so brutal it's almost funny. (Almost.)
KPI #16: Follow-up Frequency
63% of prospects need time before they're ready. But "time" doesn't mean "silence." How many touches are you making? One email and done? That's not a follow-up strategy — that's quitting. Track the number of touchpoints per lead and correlate with close rates. You'll find the magic number is usually 5-7 for local B2B.
KPI #17: Call Connection Rate
Direct mobile numbers connect at 11-14%. Switchboard? 3-5%. That's a 3x difference just from having the right phone number (Evaboot, 2026). Scrap.io classifies phone types — fixed, mobile, special — so you know before dialing. Skip the receptionist. Hit the owner's cell. Boom.
KPI #18: Sales Cycle Length
First touch to closed deal. Track the trend, not just the number. Getting longer? Something's broken in qualification. Getting shorter? Whatever you changed, do more of it. For sales pipeline KPIs for local businesses, 30-60 days is typical B2C, 60-90 days B2B.
KPI #19: Pipeline Velocity
Multi-channel outreach (email + phone + social) books meetings at 3-5% vs 1% for single-channel. That's the data from Martal Group. Pipeline velocity measures how fast leads move through your funnel. Faster velocity = more revenue per quarter with the same pipeline size.
KPI #20: Win Rate by Territory
California tech buys different than Texas healthcare. Way different. Segment win rates by geography and you'll discover pockets of gold you've been ignoring. One auto repair software company extracted 45,000 garages across TX, FL, and CA — then discovered Florida converted 2x better than the other states. They shifted budget. Pipeline exploded. Know your cold email conversion by territory or you're optimizing blind.
Industry Benchmarks for Local Prospecting (2026)
Food businesses convert at 6.64%. Luxury jewelry? 1.31%. That gap is enormous. And if you're using the same playbook for both, you deserve the results you're getting. Here are the B2B prospecting benchmarks and google maps prospecting benchmarks by industry that actually matter.
Conversion Rates by Industry
| Industry | Avg. Conversion Rate | Notes |
|---|---|---|
| Food & Beverage | 6.64% | Highest — fast decisions |
| Professional Services | 9.3% | When leads are well-scored |
| Healthcare | 3.2% | Longer sales cycle |
| Home Services | 4.8% | Seasonal variation |
| Retail | 2.1% | High volume, low intent |
| Luxury / Jewelry | 1.31% | Lowest — long nurture |
Source: First Page Sage, 2026
Cold Email Performance: Google Maps Leads vs General B2B
The average cold email reply rate in 2026 is 3.43% according to Instantly's benchmark report. But the cold email conversion rate google maps leads consistently outperforms — because the leads are real, the emails don't bounce, and you can personalize around visible signals like reviews, missing websites, or outdated listings.
| Metric | Google Maps Leads | General B2B Lists |
|---|---|---|
| Open Rate | 27.7% | 21.3% |
| Reply Rate | 5.1% | 3.4% |
| Meeting Booked | 1.5-2% | 0.5-1% |
| Bounce Rate | <2% | 4-6% |
| CPL | <$5 | $100-400 |
Sources: Instantly, Belkins, internal Scrap.io campaign data
Someone on Reddit r/DigitalMarketing put it well: "Google Maps is usually discussed in terms of local SEO, it can definitely be used as a prospecting layer, especially for local B2B." That thread had hundreds of upvotes. People are catching on.
Oh, and the comparison between Google Maps and LinkedIn for lead generation? Google Maps crushes LinkedIn for local. Not even close on CPL. LinkedIn wins for enterprise decision-makers. Different tools, different jobs.
Video: B2B Lead Gen: Google Maps vs LinkedIn
How to Track These KPIs with Google Maps Data
Want to know how to track local prospecting KPIs without losing your mind? Tracking 20 KPIs in a spreadsheet is how sales teams go insane. I've seen it happen. Guy had a 47-tab Google Sheet with color-coded conditional formatting and a pivot table that took 3 minutes to load. Impressive? Sure. Useful? He hadn't opened it in two months.
You need systems, not spreadsheets.
Step 1: Automated Data Extraction
Pull Google Maps data at scale. Whole cities. Whole states. Whole countries if you want. Two clicks on Scrap.io and you've got thousands of leads with emails, phones, reviews, websites — structured and ready for your CRM. No manual copying. No browser tabs open for 4 hours.
One search, thousands of KPI-ready leads. Scrap.io extracts business data in real time from Google Maps.
Step 2: CRM Integration
Push everything into your CRM automatically. HubSpot, Salesforce, Pipedrive, whatever you use. Set up territory fields, lead source tracking, and response time alerts. No more spreadsheet graveyards.
Step 3: Dashboard Setup
Daily numbers checked daily. Weekly pipeline reviewed weekly. Monthly KPIs in a monthly review. Use your sales dashboard templates to get started — don't build from scratch unless you enjoy suffering.
Step 4: Alerts for Everything
Response time over 10 minutes? Alert. Conversion rate dropping below 8%? Alert. CPL spiking in a territory? Alert. Don't let problems hide until the quarterly review.
GoHighLevel actually built Google Maps bulk prospecting directly into their CRM as a native feature. That tells you something — the market has decided that Google Maps data and local lead generation KPIs belong in the same workflow. Not in separate tabs. Not in separate tools.
And on Reddit r/sales, there are recurring threads with 100+ comments about Google Maps prospecting workflows. The playbook is going mainstream.
Common Mistakes When Measuring Local Prospecting
I've watched every mistake. Multiple times. Let me save you the pain.
Mistake #1: Counting Activities Instead of Results
"500 calls today!" Who cares? How many booked meetings? How many closed? Vanity metrics are comfortable. Revenue metrics are useful. Pick one.
Mistake #2: One-Size-Fits-All Benchmarks
West Coast tech isn't East Coast finance. A 5% conversion rate is terrible for food businesses but excellent for luxury retail. Segment your benchmarks or they're meaningless.
Mistake #3: Ignoring Seasonality
Restaurants go nuts during holidays. B2B dies in August. HVAC peaks in summer. Your KPIs need seasonal baselines or you'll panic every slow month for no reason.
Mistake #4: Using Outdated Benchmarks
2019 numbers in 2026? That's like navigating with a map from before they built the highway. The market shifted. Costs went up. Response expectations accelerated. Update your targets annually. Minimum.
Mistake #5: Volume Over Quality
1,000 garbage leads or 50 great ones? Some teams extract every business in a state and wonder why nothing converts. Filter first. Score second. Contact the winners. Quality compounds. Volume dilutes.
Mistake #6: Not Testing Channels
Email not working for plumbers? Maybe try calling. Calling not working for restaurants? Try contact forms — they get nearly 100% read rates. Test everything. Kill what doesn't work. Double down on what does.
Mistake #7: Ignoring Compliance
GDPR is real. CAN-SPAM is real. Google Maps data is public and legal, but you still need proper opt-out mechanisms and honest sender identification. Don't be the team that gets fined because they skipped the unsubscribe link. Stupid way to lose money.
KPI Dashboard Template for Google Maps Prospecting
OK so you've got 20 KPIs. You need a prospecting KPIs dashboard template that doesn't require a PhD to maintain. Here's what works.
Six cards. That's it. One dashboard, six numbers that tell the whole story at a glance:
| Card | Metric | Target |
|---|---|---|
| Leads Generated | Total new leads this week | Varies by team size |
| Conversion Rate | Lead-to-opportunity % | 10-15% |
| Cost Per Lead | Blended CPL this month | Industry-dependent |
| Avg Response Time | Minutes to first contact | <5 min |
| Pipeline Value | Total $ in active pipeline | 3x quota minimum |
| Win Rate | Proposals to closed % | 25-35% |
Drill down from there. Territory breakdowns. Channel comparisons. Weekly trends. But the top-level dashboard? Six numbers. If any of them turn red, you know exactly where to dig.
For full templates with formulas and layouts, check the sales dashboard templates guide. Plug in your Scrap.io data and you're running in 30 minutes.
Frequently Asked Questions
What is the most important KPI for local prospecting?
Lead-to-opportunity conversion rate. It directly measures how effectively you turn Google Maps prospects into real pipeline. Industry benchmark is 10-15% for B2B local prospecting. Everything else — volume, cost, velocity — flows from this number. If conversion is broken, nothing else matters.
How often should I track local prospecting KPIs?
| Cadence | KPIs to Review |
|---|---|
| Daily | Response time, call connection rate, new leads generated |
| Weekly | Lead volume, conversion rates, pipeline velocity, CPL |
| Monthly | CAC, CLV, CLV:CAC ratio, win rate by territory, sales cycle length |
What's a good cost per lead for local prospecting in 2026?
Median B2B CPL is $213 (HubSpot, 2026). But the range is massive: $50-$400+ depending on industry. Google Maps data extraction cuts this dramatically — platforms like Scrap.io deliver leads at a fraction of a cent each. The real question isn't "what's a good CPL?" — it's "what's MY CPL relative to what each lead is worth?"
How can Google Maps data improve my KPI tracking?
Real-time business data means accurate lead scoring from day one. Google reviews serve as instant quality signals. Website presence, social profiles, and contact form detection let you score leads before sending a single email. Fresh data = lower bounce rates, higher connect rates, better local prospecting KPIs across the board.
Which KPIs should startups prioritize for local prospecting?
Five. Start with these and expand later: lead volume (are you generating enough?), conversion rate (are they any good?), cost per lead (can you afford this?), average deal size (is it worth the effort?), and sales cycle length (how fast can you close?). Everything else is optimization. These five are survival.
Ready to generate leads from Google Maps?
Try Scrap.io for free for 7 days.