

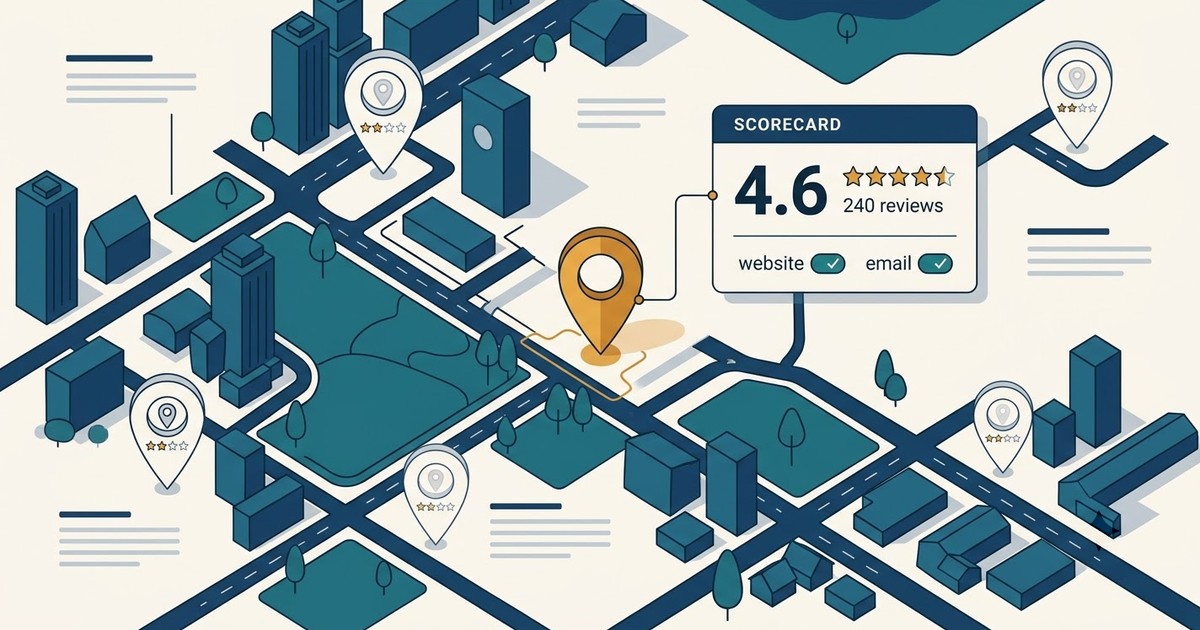
Dana runs three coffee bars in Austin. Good beans, loyal regulars, a barista who latte-arts a passable fern. Ask her how she stacks up against the shop two blocks over and she'll say "pretty well, I think." I think. That's the whole problem in two words.
Because "I think" is not a number. And in a city with 963 coffee shops fighting for the same commuters, a hunch is not a strategy. This is where competitor benchmarking earns its keep: it swaps the gut feeling for a score you can actually defend.
Here's the frustrating part. Search "competitor benchmarking" and you get a decade of the same recycled advice about social media dashboards and SWOT grids. Almost none of it tells a local business how to measure the rivals it can literally walk to. So that's what this guide does, using live Google Maps data, a repeatable scoring method, and a free template you can steal at the bottom.
Video: How Pizzerias Spy on Competitors Using Google Maps
- What Is Competitor Benchmarking?
- Why It Matters More in 2026
- What to Benchmark: 6 Dimensions That Actually Decide Who Wins Locally
- How to Do Competitor Benchmarking: A 6-Step Process
- Real Example: Austin Coffee Shops
- Best Competitor Benchmarking Tools in 2026
- Your Free Competitor Benchmarking Template
- Is This Legal? A Quick Compliance Note
- FAQ
What Is Competitor Benchmarking?
Most competitor research is just screenshotting someone's pricing page and nodding. Benchmarking puts a number on it.
Competitor benchmarking is the ongoing process of measuring your business against direct competitors using defined, comparable metrics: ratings, reviews, pricing, web presence, and more. It's repeatable and quantitative, and it turns a vague "we're doing fine" into an actual figure you can track over time. That's the snippet-worthy version. Competitive benchmarking (same thing, different label) is what serious teams do instead of guessing.
The keyword there is defined. You don't benchmark vibes. You pick metrics that mean something, measure yourself and a panel of rivals on each one, and see where you land. Ahead? On par? Behind? Now you know, and you can prove it.
And no, this isn't the same as competitor analysis, even though people smash the two together constantly. Let's clear that up, because the distinction changes what you actually do on a Tuesday morning.
Benchmarking vs. analysis vs. intelligence
Three words, three jobs. Competitor analysis describes what your rivals are doing (their menu, their offers, their vibe). Competitive intelligence is the wider practice of watching the market for moves and threats. Competitor benchmarking is the one that hands you a scorecard. Here's the clean version:
| Approach | Question it answers | Nature | Output |
|---|---|---|---|
| Benchmarking | Where do we stand vs. the panel? | Quantitative, repeated | A scorecard |
| Analysis | What are they doing? | Qualitative, one-off | A write-up |
| Intelligence | What's changing in the market? | Ongoing monitoring | Alerts & signals |
If you want the qualitative side of this, our guide to Google Maps competitor analysis covers the "what are they doing" question in depth. This article is the "where do we stand" half. Use both. They're better together.
Why It Matters More in 2026
The competitive intelligence tools market is now worth $557.6 million in 2026, on track to hit $1.28 billion by 2033 at a 12.6% CAGR (Coherent Market Insights, 2026). Companies are pouring money into this. The question is whether you're getting the same edge without the enterprise invoice.
And it's concentrated where you probably operate. North America holds around 40% of that entire market (Coherent Market Insights, 2026). Translation: if you're a US business, your competitors are almost certainly already doing some version of this. Comforting, right?
Here's why benchmarks beat instinct, in three quick numbers. The #1 spot in Google organic search grabs 27.6% of clicks versus just 6.3% at position five (Backlinko). Being "roughly there" isn't the same as being on top, and only a benchmark tells you the gap. On the demand side, 90% of people buy from brands they follow on social (MarketingDive, via Supermetrics), and a load time over two seconds sends 47% of visitors packing (Shopify, via Supermetrics). Every one of those is a benchmark line. Every one is a place you're quietly ahead or quietly bleeding.
One more, because retention is where local businesses live or die: returning customers drive roughly 65% of a company's annual revenue (SmallBizGenius, via Supermetrics). Benchmark your review sentiment and rating against the shop down the street, and you're really benchmarking whether those regulars stay yours. This is the same instinct behind broader competitive intelligence that lets you spy on competitors' local presence, just aimed at a scorecard instead of a feed.
And this isn't theory reserved for enterprise teams. Nunzio Ross, who runs Majesty Coffee, deliberately benchmarks against nearby shops because, in his words, "the local scene allows us to have closer, more accurate metrics" to measure against (via Supermetrics). Rival IQ tells the same story from the opposite end of the size scale: benchmarking Alaska Airlines on Instagram engagement landed it in 6th place among peers, which is precisely the nudge to go study what Hawaiian Airlines does better. Same discipline. Wildly different businesses. It even scales across functions, as DoorLoop's David Bitton points out: benchmarking helps you find "your individual pain point" in customer support, then copy the industry best practices that fix it (via Supermetrics).
What to Benchmark: 6 Dimensions That Actually Decide Who Wins Locally
You could track fifty metrics. Please don't. Fifty metrics is how a benchmarking project dies in a spreadsheet nobody opens. Which six actually decide who wins locally? These:
- Rating. The average star score. The single fastest read on whether customers leave happy.
- Reviews (volume). Notoriety and trust in one number. A 4.9 with 12 reviews loses to a 4.6 with 400.
- Web presence. Do they even have a website? Roughly a fifth of local businesses still don't, and that's a gap you can drive a truck through.
- Contactability. Is there an email you (or a customer) can actually reach? Fewer than half of listings offer one.
- Recency. When did the listing first appear? New rivals are the ones you catch before they catch you.
- Pricing tier. The $, $$, $$$ signal, plus whatever their menu gives away. If you want the deep version, here's how to track and beat competitor pricing.
Notice what's on that list and what isn't. No brand-sentiment moonshots, no "share of voice" abstractions. Just six things you can pull, score, and act on. Perception (dimension one and two) is worth a deeper pass on its own, and you can analyze Google reviews at scale to see why a rival's rating is what it is, not just the number. But for a first benchmark? These six. That's your competitor benchmarking framework, and it fits on an index card.
How to Do Competitor Benchmarking: A 6-Step Process
Benchmarking is only useful if it changes a decision. So this whole process is built backward from that: measure the things that would make you act, then act. Here's how to do competitor benchmarking without drowning in tabs. Six steps.
Step 1: Define your objective
Start with the decision you're trying to make. "Should I push harder on reviews this quarter?" is an objective. "Let's look at competitors" is not. Pick one thing you'd change based on the answer. Everything downstream gets easier once that's nailed down.
Step 2: Build your competitor set
This is where most people cheat, and it wrecks the whole benchmark. They pick "the 20 competitors I already know." But your real panel is the whole category in your area, not the handful you happen to remember. In Austin, that's not 20 coffee shops. It's 963.
The trick is defining the set by category and geography, not by memory. Pick your category (Google recognizes 4,000+ of them, and our guide to Google Maps categories shows how to nail the right one), then draw your zone: a city, a radius, or a hand-drawn polygon around the exact trade area you fight in. A radius search covers "everyone within X miles of me." A polygon carves out a neighborhood that ignores city lines.
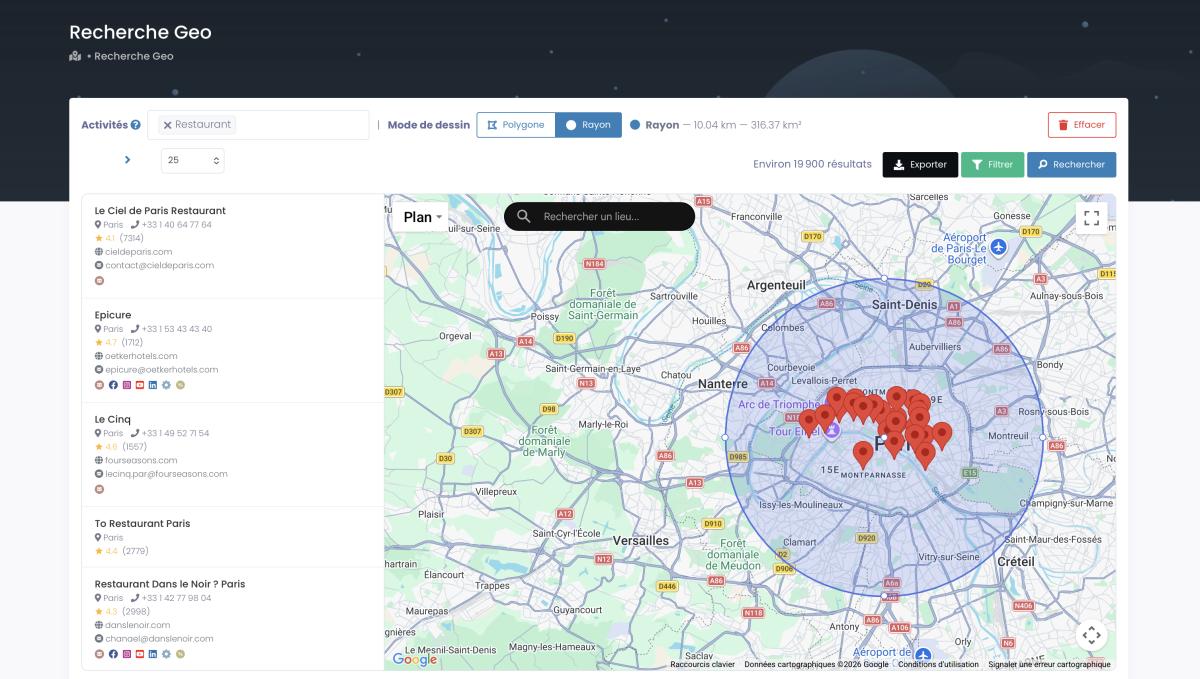
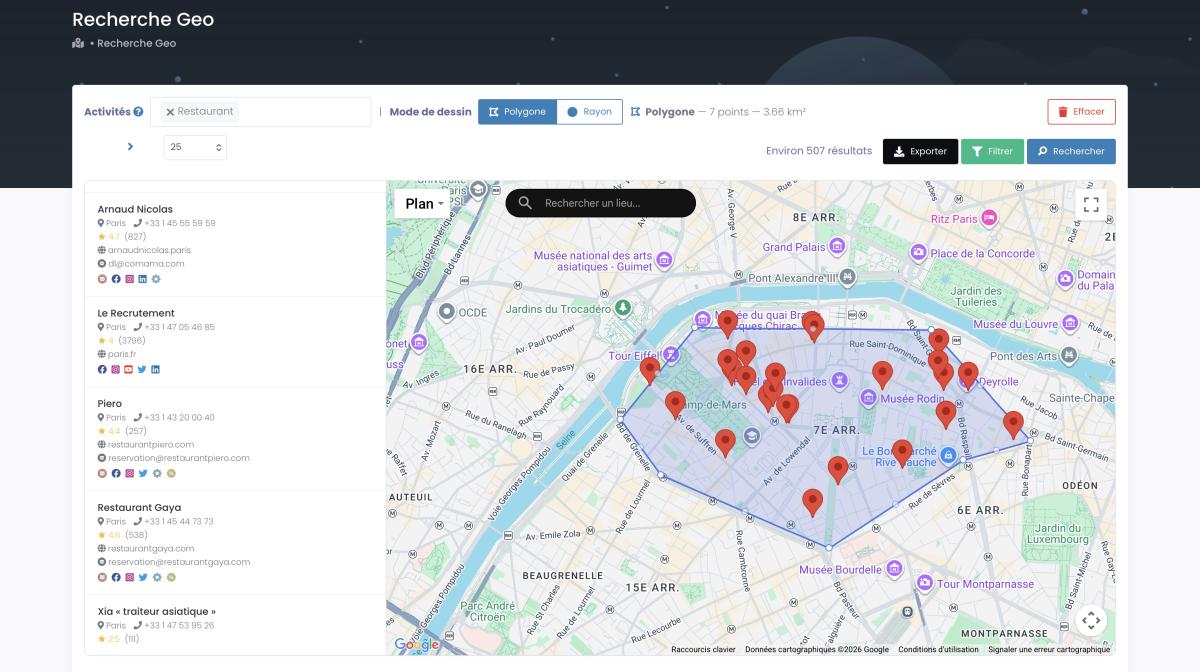
Step 3: Pull the data (Google Maps)
Now you fill in the numbers. For each business in your set, you want the six dimensions from above: rating, review count, website yes/no, email yes/no, first-seen date, price tier. Do this by hand for five rivals and it's a coffee break. Do it for 963 and it's a lost week you'll never get back.
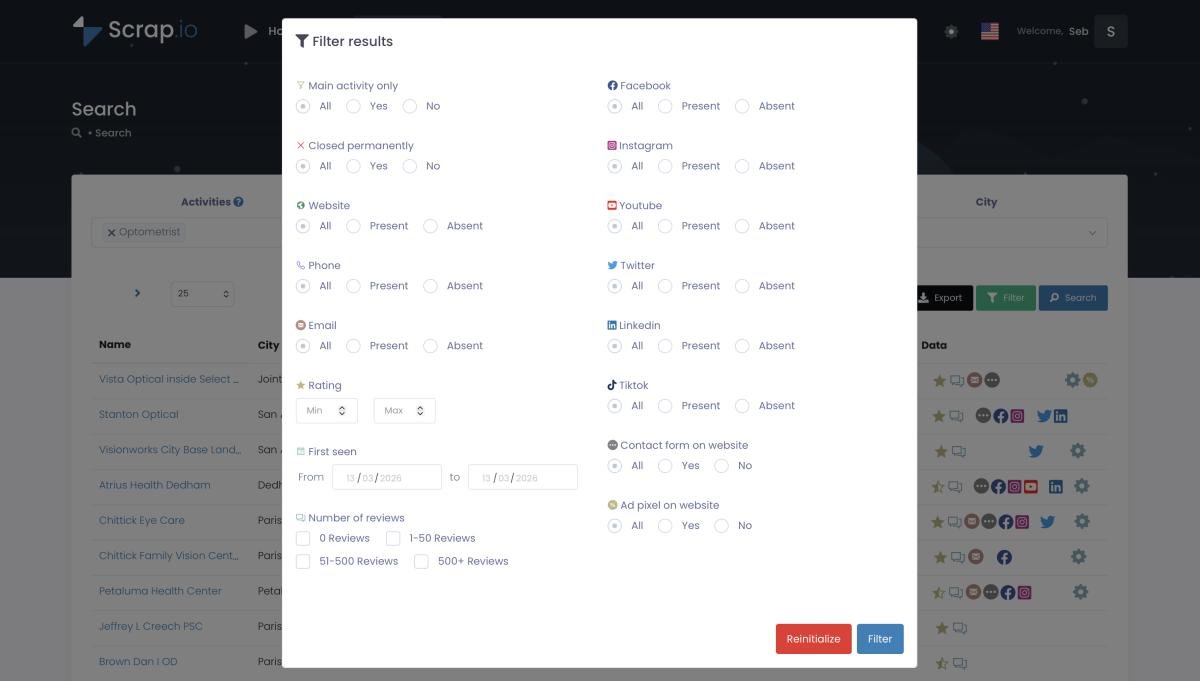
So don't. A tool like Scrap.io pulls every listing in your category and zone straight from Google Maps, in real time, and lets you filter before you spend anything. Only want shops with a rating above 4.5? Only ones missing a website? Filter first, then export a clean CSV. The counts themselves are free, which matters for benchmarking, because you're measuring proportions, not buying every row.
See how many competitors are actually in your market before you benchmark a single one. Run a free count on Scrap.io across 225M+ Google Maps listings in 195 countries. Counting costs zero credits.
Step 4: Normalize and score (build the matrix)
Raw numbers lie until you give them context. A 4.6 rating sounds great, until you learn the market average is 4.7. So you normalize: turn each metric into a simple status against a benchmark threshold. Green if you're ahead, yellow if you're on par, red if you're behind.
Lay it out as a matrix. Rows are your six dimensions. Columns are you plus your closest rivals (anonymize them as Competitor A, B, C if you like). Add a "market benchmark" row at the bottom as your reference line. That's your competitor benchmarking analysis in one view, and honestly, the moment you build it, the gaps jump off the page. We'll hand you the exact template in a minute.
Step 5: Find the gaps
Read the reds. That's it, that's the step. Where you're behind the benchmark is where the money is. Behind on review count but ahead on rating? You've got happy customers who aren't leaving reviews, which is the easiest fix in local marketing. Behind on web presence? You're invisible to half the searches. The gaps aren't failures. They're a to-do list, sorted by impact. As Alex Chaidaroglou of Altosight puts it, "you can learn which areas you can upgrade on when studying competitors" (via Supermetrics). That's the entire value of the exercise in one line.
Step 6: Turn it into action, then re-run
A benchmark you run once is a photo. A benchmark you re-run is a movie, and the movie is what actually helps. Markets move. New shops open. A rival's rating slips. Set a monthly or quarterly re-run so you catch the changes while they still matter, not six months after they've lapped you. Watching for brand-new competitors is half the game, and the "first-seen" date is how you spot them the week they open.
Video: Find Businesses That JUST Opened (Before Your Competitors Do)
Then feed the wins back into your pipeline. A benchmark that flags "50 nearby shops with no website" isn't just intel, it's a lead list. That's how the same data powers turning local data into leads once you've spotted the gaps.
Real Example: Austin Coffee Shops
Enough theory. Let's benchmark a real market. We pulled the numbers for coffee shops in Austin, Texas, live from Scrap.io in September 2026. Took seconds. Here's what the city looks like on our six dimensions:
| Segment | Count | Share | What it tells you |
|---|---|---|---|
| Total coffee shops | 963 | 100% | The real size of the market |
| With a website | 766 | ~80% | ~1 in 5 has no site: pure opportunity |
| With an email on the site | 469 | ~49% | Fewer than half are reachable by email |
| Rating of 4.5 stars or higher | 419 | ~44% | Your quality benchmark |
| 200 reviews or more | 371 | ~39% | Your notoriety benchmark |
Now watch what happens to Dana. Her flagship sits at 4.6 stars with 240 reviews. Feels good, but "feels" was never the point. Against the benchmark? She clears the 4.5-star bar that only ~44% of the city clears, and she's past the 200-review mark that only ~39% reach. Concretely: beat 4.5 stars and 200 reviews and you're already ahead of roughly six competitors out of ten. That's not a hunch anymore. That's a number with a threshold behind it.
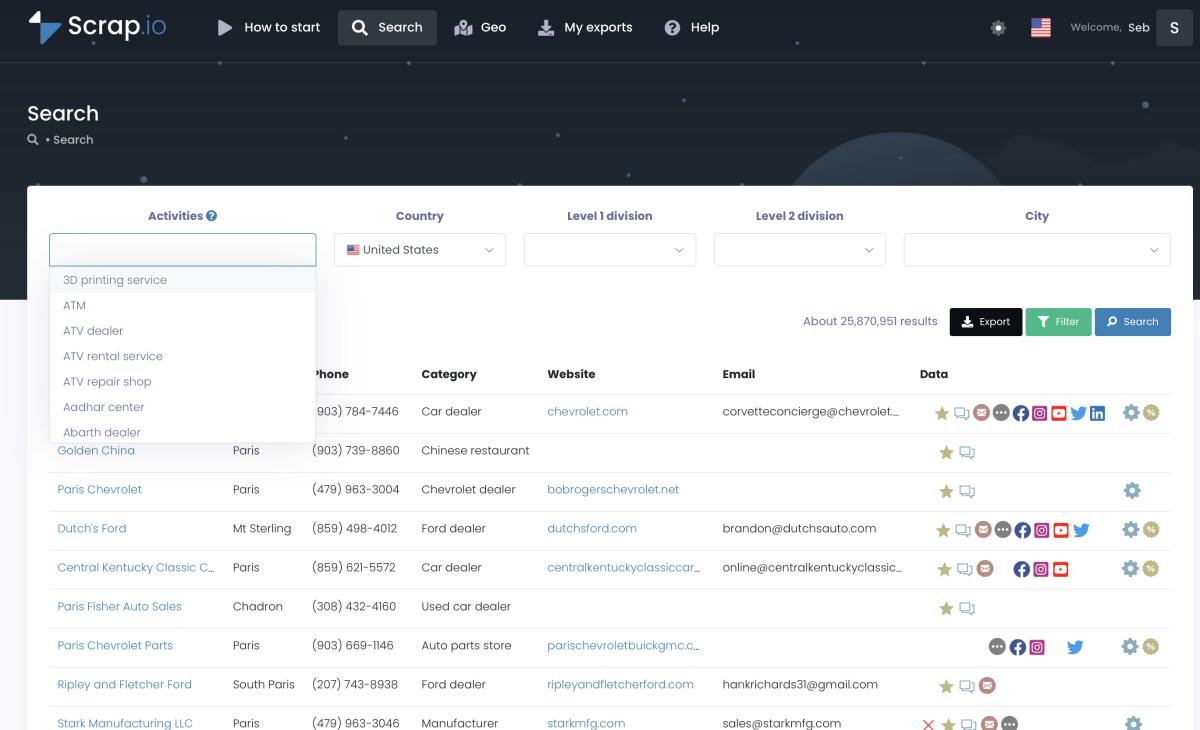
And the gap that should keep her rivals up at night? That ~20% with no website, and the ~51% you can't email. If Dana wanted to poach regulars from underperforming shops, she now knows exactly how many targets exist and how to reach them. A benchmark is a threshold, not an impression.
These numbers came straight from Scrap.io in seconds, filtered before a single credit was spent. Run the same benchmark for your own city: pick your category, pick your zone, get your market's real scorecard.
Best Competitor Benchmarking Tools in 2026
Do you need a $2,000-a-month enterprise suite for this? No. You need the right tool for the axis you're benchmarking, because "competitor benchmarking tools" is really four different jobs wearing one name. Here's the honest breakdown.
| Tool | Best for | Benchmarking axis | Local / physical? |
|---|---|---|---|
| Rival IQ | Social media benchmarking | Engagement, followers | No |
| Semrush | SEO & digital benchmarking | Rankings, traffic | Partial |
| Supermetrics | Multi-source data plumbing | Cross-channel KPIs | No |
| Scrap.io | Local / physical benchmarking | Ratings, reviews, web presence, by market | Yes |
See the pattern? The famous names all benchmark the digital world: tweets, keywords, dashboards. Great tools, genuinely. But not one of them will tell you how many coffee shops in your zip beat your star rating. For the local, physical, on-the-map benchmark, that's Scrap.io's lane, precisely because it reads the whole market from Google Maps rather than a handful of websites. If your benchmarking spills into broader market work, our roundup of competitive intelligence tools goes wider.
Enterprise-style guides (Fusepoint Insights lays out a genuinely solid six-dimension methodology, for instance) are worth a read too. But they stay abstract, lean corporate, and skip the local, physical angle almost entirely. No named market, no template. That's the gap this guide fills.
And the honest bit, since we're being honest: most serious benchmarks end up using two tools. Rival IQ or Semrush for the digital axis, Scrap.io for the physical one. Different jobs. Both worth doing.
Your Free Competitor Benchmarking Template
Right, the practical part. Steal this scorecard. It's the whole method compressed into one grid you can rebuild in any spreadsheet in five minutes. Fill the "You" column with your numbers, add a couple of rivals, drop in the market benchmark, and color each cell green, yellow, or red.
| Metric | You | Competitor A | Competitor B | Market benchmark |
|---|---|---|---|---|
| Rating | 4.6 🟢 | 4.4 🟡 | 4.8 🟢 | 4.5 |
| Reviews | 240 🟢 | 180 🟡 | 610 🟢 | 200 |
| Website | Yes 🟢 | Yes 🟢 | No 🔴 | ~80% have one |
| Email / contact | Yes 🟢 | No 🔴 | No 🔴 | ~49% have one |
| Recency (first seen) | 2019 🟡 | 2011 🟢 | 2025 🔴 | varies |
Read it like a heat map. Your reds are your roadmap. Competitor B has a monster review count but no website and no email, which tells you exactly how to out-position them online. Competitor A is reachable nowhere. And that fresh 2025 arrival? Watch it. That's a competitor benchmarking matrix doing its job: one glance, and you know where to push.
The only hard part is filling the "market benchmark" column with real numbers instead of guesses, and that's exactly what a live Google Maps pull gives you.
Fill your scorecard with live data, not guesswork. Start your free 7-day Scrap.io trial: 50 searches and 100 export credits, no commitment. Pull your market's real rating, review, and web-presence benchmarks in minutes.
Is This Legal? A Quick Compliance Note
Scraping competitor data for benchmarking, allowed? Yes, within limits. And the limits are simpler than the scare stories suggest.
Everything in this method uses publicly available business data: names, ratings, review counts, websites, categories. That's information businesses chose to publish on a public map. In the US, courts have repeatedly held that collecting publicly accessible data is fair game, and both GDPR (in the EU) and CCPA (in California) carve out public business information from the strict rules that govern personal data. The line to respect: stick to business-level data for benchmarking, and tread carefully if you ever pull an individual reviewer's personal details.
This is also why tool choice matters. Scrap.io works only with publicly available business data, keeps every record traceable to its source, and stays GDPR- and CCPA-compliant. Public, traceable, business-only. Hold any benchmarking tool to that same bar and you're on solid ground.
FAQ
What is competitor benchmarking?
Competitor benchmarking is the ongoing process of measuring your business against direct competitors using defined, comparable metrics like ratings, reviews, pricing, and web presence. It's repeatable and quantitative, which turns a vague "we're fine" into an actual number you can track and act on.
Can you give me an example of competitor benchmarking?
Sure. Take Austin coffee shops: 963 in the city, ~44% hold a rating of 4.5 stars or higher, and ~39% have 200 reviews or more (Scrap.io, September 2026). So a shop sitting at 4.6 stars with 240 reviews is already ahead of roughly 60% of the market on both metrics. That's a benchmark: a number with a threshold, not a gut feeling.
What's the difference between benchmarking and competitor analysis?
Competitor analysis describes what your rivals do (their offers, their positioning, their menu), and it's usually qualitative and one-off. Competitor benchmarking measures where you stand against them on defined metrics, and it's quantitative and repeated. Analysis is the write-up. Benchmarking is the scorecard. For the analysis side, see our Google Maps competitor analysis guide.
Which tool is best for competitor benchmarking?
It depends on the axis. For social media, Rival IQ or Sprout. For SEO, Semrush. For multi-source data, Supermetrics. For local and physical businesses benchmarked on live Google Maps data (ratings, reviews, web presence across a whole market), Scrap.io is the most direct fit. Most serious benchmarks combine a digital tool with a local one.
Is a SWOT the same as a competitor benchmark?
No. A SWOT analysis is a qualitative, internal snapshot of your strengths, weaknesses, opportunities, and threats. A competitor benchmark is external, quantitative data on how you stack up against rivals. They complement each other: the hard numbers from your benchmark are exactly what should feed the "weaknesses" and "threats" quadrants of a credible SWOT.
The bottom line
Dana's "I think" was never going to cut it in a 963-shop market. Neither will yours. The whole point of competitor benchmarking is to replace the hunch with a scorecard: six dimensions, a market benchmark, and a monthly re-run so you catch the market moving before it moves on you.
Do the free version this week. Pull your category and your zone, fill the template, read the reds. Then act on the biggest gap and re-run it next month. That's competitive benchmarking, minus the enterprise invoice and the guesswork.
Stop guessing where you rank locally. Try Scrap.io free for 7 days: 50 searches and 100 export credits, across 225M+ Google Maps listings in 195 countries. Build your first benchmark scorecard today, and finally put a number on "I think."
Generate a list of restaurant with Scrap.io