62% of B2B companies don't measure the ROI of their customer experience programs. Forrester dropped that stat in 2025 and it stuck with me. Six out of ten. Making budget calls, hiring calls, go-to-market decisions — without knowing what a single customer is actually worth over time.
I've sat across from founders who know their MRR to the cent and then go completely blank when you ask about their customer lifetime value formula. The phrase sounds like a finance textbook nobody volunteered to read. It isn't. We're taking it apart today — the simple version, the SaaS version, the B2B version, and the one ratio that turns all of it into an actual weapon.
What Is Customer Lifetime Value (And Why It Matters in 2026)
Customer Lifetime Value — people say CLV, CLTV, LTV, whatever, it's all the same thing — is the total revenue you can expect from one customer across the entire time they stick around.
You probably knew that part already. So here's the more interesting question: why do so many B2B teams still get it so wrong?
Think about the difference. In B2C, you've got thousands of transactions to crunch. Someone buys sneakers four times a year, you model it, done. B2B is a completely different animal. Maybe 47 clients total. Sales cycles that drag on for months. Deal sizes that swing from $3,000 to $180,000 depending on the account. Someone on r/datascience put it perfectly: "We just stare at a spreadsheet full of averages and hope for the best." Yeah. That's most companies.
Then there's the silo problem. Revenue lives in one tool. Churn data in another. Support tickets somewhere a third. So people throw their hands up and wing it.
But the teams who crack it? Huge edge. Bain & Company (the research popularized through Harvard Business Review) found that a 5% bump in retention lifts profits anywhere from 25% to 95%. Gainsight and Forrester's 2025 data pegs 76% of B2B annual revenue as coming from existing customers. McKinsey's 2025 research says personalization done right drives 40% revenue gains, and omnichannel customers carry 30% higher CLV.
Oh, and B2B loyalty programs are posting an 82% retention increase, a 79% CLV increase, and 4.8× ROI. Those numbers genuinely surprised me. Companies that understand how CLV transforms local B2B prospecting are playing a different game entirely.
All of which is to say: your customer value formula isn't a nice-to-have. It's the line between guessing and knowing.
The Basic Customer Lifetime Value Formula
Let's start where everyone should. If you've ever wondered how to calculate lifetime value of a customer, this is your section.
Here's the simple customer lifetime value formula:
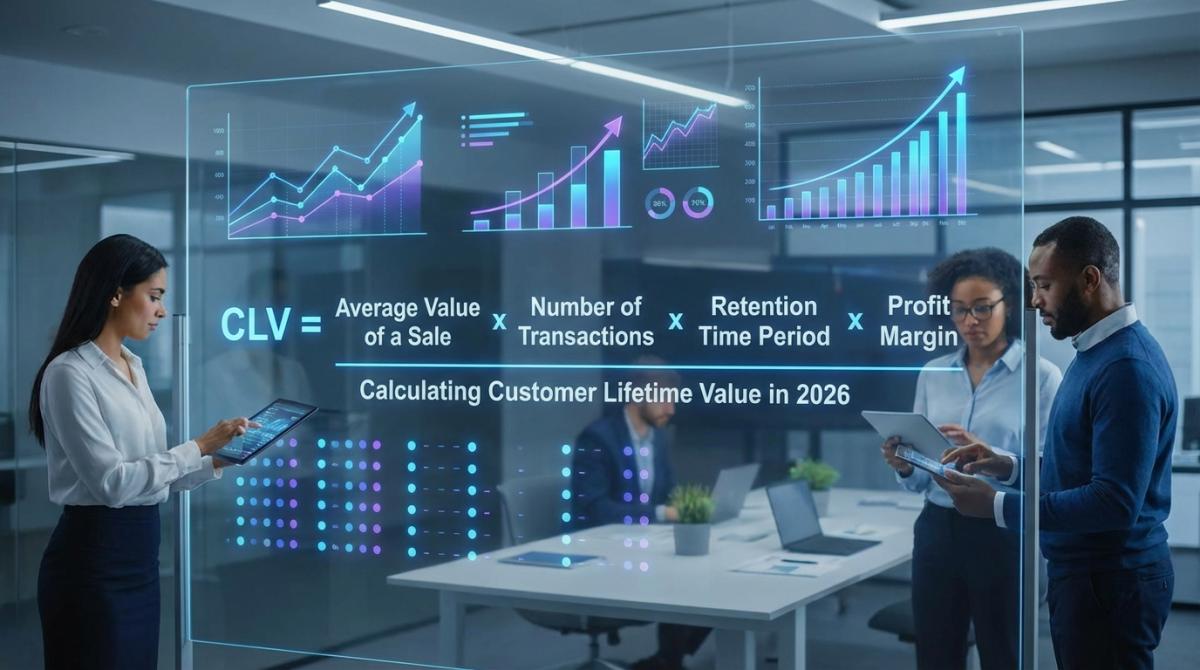
CLV = Average Purchase Value × Purchase Frequency × Customer Lifespan
The customer lifetime value formula is three numbers multiplied together: your average purchase value, how often a customer buys, and how many years they stay. Multiply the three and you've got the total revenue one customer is worth over their lifetime. That's the whole thing. Forty seconds of math.
Now the pieces:
Average Purchase Value. Total revenue divided by number of purchases. $500,000 across 100 deals = $5,000 per purchase.
Purchase Frequency. How often one customer buys. Annual contracts? That's 1. Monthly orders? That's 12.
Customer Lifespan. How many years the average customer sticks before walking. Trickiest to pin down, but we'll fix that in a second.
Quick customer lifetime value example. Meet Mike. Mike runs a B2B shop, his average client pays $5,000 a year, buys once a year, and stays about 4 years. His CLV? $5,000 × 1 × 4 = $20,000. Not scary. And now Mike knows each new client is worth roughly twenty grand over their life — which completely changes how much he's willing to spend to land one.
When do you reach for this version? Board decks. Back-of-napkin estimates. Early-stage companies that haven't been around long enough to build fancy models. It's a starting point, not the final word. But it's a really good starting point.
Customer Lifetime Value Formula in Excel (Step-by-Step)
Let's knock this out. Open a spreadsheet. Column A: Purchase Value. Column B: Frequency. Column C: Lifespan. Column D: =A2*B2*C2. Done. This customer lifetime value formula excel setup lets you sort your entire customer base by CLV in one click.
For SaaS, the cell reads =(Gross Margin% * ARPU) / Churn Rate. And if you want real accuracy, build a separate tab per customer cohort — group by signup quarter. Folks on r/analytics keep hammering this point: cohort-based CLV beats one giant average every single time. Your 2022 customers behave nothing like your 2025 ones. You don't need a fancy CLV calculator for any of this — a well-built spreadsheet does the job.
How to Calculate CLV for B2B and SaaS Companies
That said, the basic formula has a ceiling. Running a SaaS product or selling complex B2B services? You need formulas built for your model. Some people call it the LTV formula, others say CLV calculation — same destination, different roads.
The SaaS version. This is the customer lifetime value SaaS formula, and honestly I think it's cleaner than the basic one:
CLV = (Gross Margin % × ARPU) / Customer Churn Rate
Quick math. Gross margin 80%, ARPU $200/month, monthly churn 3%. That's (0.80 × $200) / 0.03 = $5,333. Notice this formula already bakes in the customer lifetime value formula retention rate, because churn is just retention flipped. If 3% leave, 97% stay. Same coin, two faces. Wall Street Prep breaks down this exact SaaS CLV calculation if you want the finance-grade version with a downloadable model.
The B2B Services version:
CLV = (Average Revenue Per Customer × Customer Lifespan) − Acquisition Cost
This one subtracts what it cost to win the client in the first place. Way more honest for agencies and consulting firms, where acquisition costs can get brutal.
And here's the formula I reach for constantly. The customer lifespan formula: Customer lifespan = 1 ÷ churn rate. Ten percent annual churn means the average customer stays 10 years. Twenty percent means five. Dumb-simple division. Changes everything the moment you plug it into a model.
| Business Model | Recommended Formula | Best For |
|---|---|---|
| Local Services | Purchase Value × Frequency × Lifespan | Repeat transaction businesses |
| SaaS | (Gross Margin % × ARPU) / Churn | Subscription companies |
| Professional Services | (ARPC × Lifespan) − Acquisition Cost | Consulting, agencies, B2B services |
I know the objection forming in your head. "We've got like 50 clients, this can't possibly apply to us." It absolutely can. Even with a tiny account base, running these numbers shows you which segments deserve more budget. No data science team required. Executive judgment plus the basic formula gets you 80% of the way there.
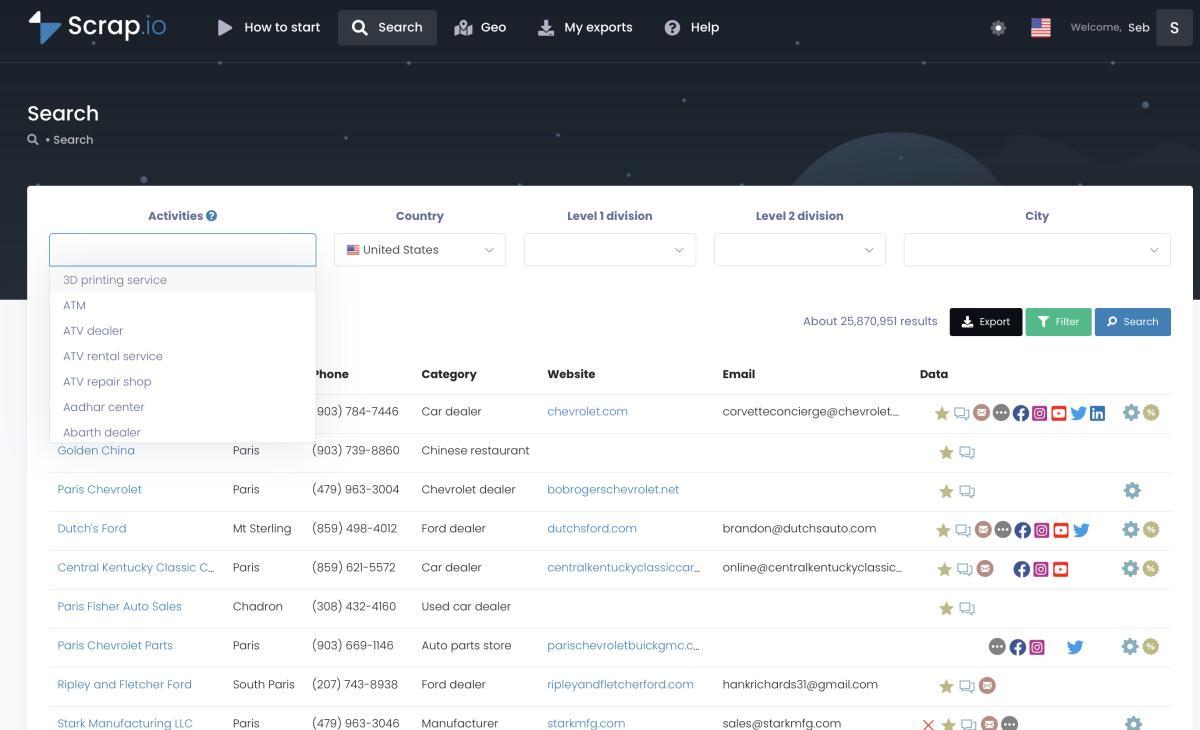
Here's the catch nobody mentions: your CLV is only as good as the data feeding it. Garbage prospect data in, garbage forecast out. Scrap.io pulls real-time business data straight from Google Maps — 225,676,406 listings across 195 countries, refreshed at the moment you export. Not some six-month-old spreadsheet someone's flipping for $500. Start with a free 7-day trial and 100 leads included.
Advanced CLV Formula with Discount Rate
This one's for the finance crowd. Or anyone juggling long-term contracts where the time value of money actually matters.
CLV = Gross Contribution × (Retention Rate / (1 + Discount Rate − Retention Rate))
The customer lifetime value formula with discount rate says a dollar five years out isn't worth a dollar today. Use it for multi-year B2B contracts, or whenever your CFO wants NPV-adjusted numbers.
But honestly? For most B2B companies, executive judgment plus the simpler formulas works fine. Start with deal size times renewals times retention, then refine. Don't over-engineer a spreadsheet nobody will maintain past week two.
CLV vs. CAC — The Golden Ratio
This is where your CLV calculation turns into an actual weapon. CLV on its own is just a number. Pair it with Customer Acquisition Cost and you've got the single most important ratio in B2B.
CLV:CAC Ratio = CLV / Customer Acquisition Cost
The CLV vs CAC ratio benchmark: 3:1 minimum for a healthy business. 5:1 is the sweet spot. Below 1:1 you're paying more to acquire customers than they'll ever pay back — that's not a business, that's a charity with worse marketing. Above 5:1 might actually mean you're under-spending on growth. Chargebee's data backs the benchmark up: their LTV:CAC ratio breakdown even shows it swinging by industry, from 2.5:1 in entertainment to 4:1 in B2B SaaS. If your ratio's sitting comfortably above 3:1, maybe it's time to reinvest in finding new B2B SaaS clients.
Customer acquisition cost vs lifetime value stops being a textbook idea the second it starts driving real calls. Pricing. Budgets. Channel strategy. Which markets to walk into. Which ones to walk away from. The ratio tells you all of it — and it's the backbone of any serious customer lifetime value analysis. Want to go deeper on the other half? Here's the full guide to customer acquisition cost.
Real-World CLV Examples That Prove the Math Works
Enough theory. Let's look at companies actually doing this and printing money because of it.
Starbucks. Everyone's go-to example, and for good reason. Their average customer spends around $25,272 over a lifetime. Profit margin on that? 21.3%. Customer satisfaction parked at 89%. None of that is luck. Every loyalty perk, every app ping, every pumpkin-spiced whatever — it all ladders back up to maximizing lifetime value per customer. So what is a good customer lifetime value? Depends entirely on your model. For a coffee chain, $25k is elite. For an enterprise SaaS company, that's a rounding error on one account.
Netflix. CLV of roughly $291.25, built on a 25-month average lifespan and $8.97/month ARPU. Sounds tiny next to Starbucks, right? Now multiply it across 250+ million subscribers. Every price hike, every renewed show — there's a CLV calculation sitting behind it.
Adidas adiClub. 240 million members. The loyalty crowd buys 50% more often and generates 2× the lifetime value of non-members. That's what happens when you design a program around CLV data instead of firing off random discounts and praying.
Astrid & Miyu. Smaller brand, absurd numbers. Loyalty members spend 220% more per year and are 6× more likely to repurchase. Proof you don't need to be a Fortune 500 to make CLV pay off.
The B2B angle — predictive CLV. Here's where it gets interesting for anyone selling to other businesses. IBM draws a sharp line between historic CLV (what a customer has already spent) and predictive CLV, which uses an algorithm on your historical data to forecast the full value of a relationship — factoring in acquisition costs and purchase frequency along the way. For B2B, where a single account can compound over years, that predictive lens is where the real money hides. IBM's own breakdown of the CLV model is worth a read if you want the enterprise framing.
What do all these companies share? They use CLV to decide where the money goes. Not vibes. Not whoever's loudest in the Monday meeting. Actual math, wired into an actual sales pipeline for local leads and a real retention strategy.
How to Use CLV to Prioritize Your Prospecting
So you've run the numbers. Now what? How does any of this change what you do Monday morning?
Not every lead becomes a $50,000 lifetime customer. Some churn in three months and leave. The whole game is figuring out which is which before you torch your acquisition budget.
Picture the sales team that skips this. They treat every lead identically. Same outreach, same effort, same energy on the whale and the minnow. Meanwhile the crew down the street pours 80% of their firepower into the 20% of prospects most likely to become high-CLV accounts. Who's winning that fight? Not a trick question.
Start with your existing customers. Sort by CLV. Look at the top 20% — what's the pattern? Industry? Company size? Strong reviews? Real online presence? That pattern is your Ideal Customer Profile. Go define your Ideal Customer Profile properly and use it to filter every new prospect that comes in.
Then put your money where the value is. Best budget goes to the highest-CLV segments. Run account-based marketing against accounts that mirror your top customers. The segments that churn fast and spend little? Stop dumping thousands into them. And if you want a repeatable system for ranking prospects before you dial, this lead scoring playbook for local leads lays out the exact framework.
Video: Scrap.io vs Apollo — Which Tool for Which Type of Prospecting?
AI is sharpening every bit of this. Reports out of 2025 show AI lifts CLV forecast accuracy by 25–40%. Health scoring flags churn 3–6 months out. Customer success programs tied to CLV data show 15–25% churn reduction (SaaStr and Gainsight). And 58% of consumers walk after one bad experience. One. So retention isn't just product quality — it's every single interaction.
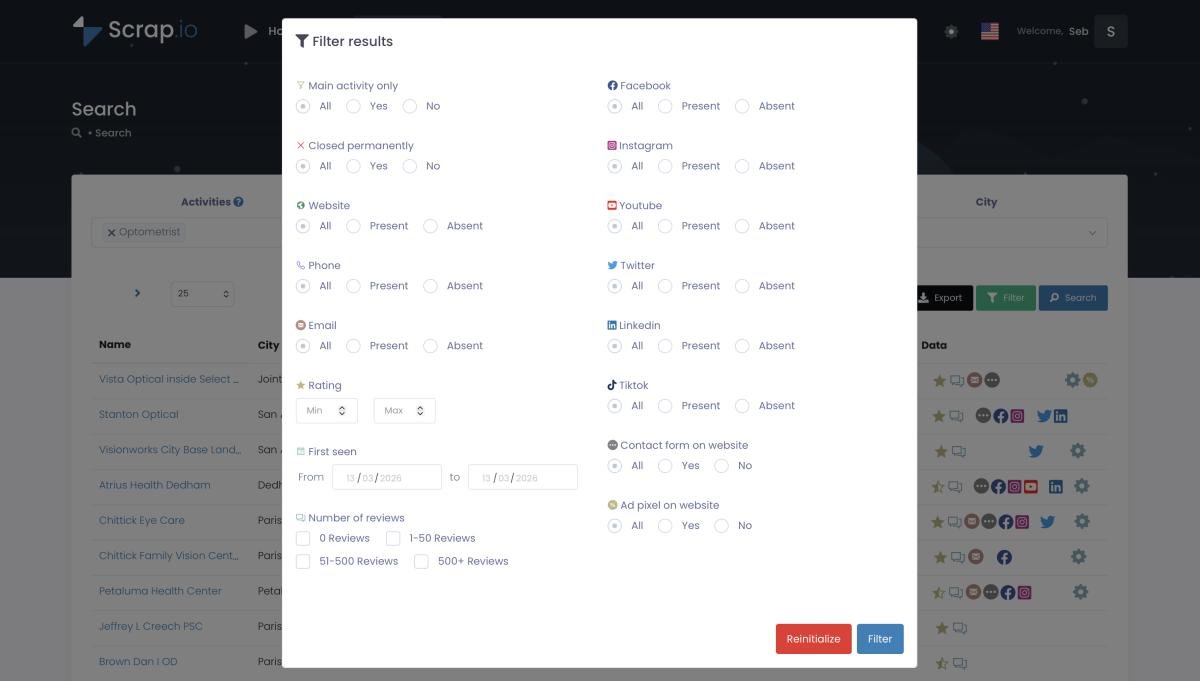
What if you could spot the high-CLV prospects before spending a dime chasing them? Scrap.io's filters let you sort by rating, review count, and website presence — all proxies for an established, growing business — and they apply before you burn a single credit. You only pay for leads worth having. Your first 100 are free.
Common CLV Mistakes (And How to Avoid Them)
I've watched teams repeat the same errors on loop. Painful every time.
Averaging everything into mush. Your 2023 cohort is not your 2025 cohort. Different market, different pricing, different onboarding. Dumping them all into one number buries every useful trend. Build cohort models. Group by signup quarter. Thirty extra minutes of setup, wild clarity in return.
Pretending churn doesn't exist. I've seen real spreadsheets projecting CLV with zero churn baked in. Customer lives forever, pays forever, never leaves. That's not a model. That's a wish. The customer lifetime value formula with churn is not optional, and the customer lifespan formula — 1 divided by churn rate — belongs in every model you build.
Ignoring discount rates on long deals. Past the 4–5 year mark, a future payment is worth meaningfully less than today's dollar. Inflation, opportunity cost, risk. Account for it or overstate every long-contract CLV you touch.
Calculating CLV and then doing absolutely nothing. This one drives me up a wall. Pretty dashboard, quarterly review slide, and then… nothing changes. CLV only earns its keep when it drives action. Wire it to CAC. Tie it to your local prospecting KPIs and track it on a sales dashboard your team actually opens. Otherwise it's just a number nobody looks at after Tuesday.
Never updating the model. Markets move. Churn shifts. If your CLV calculation is eighteen months old, it's fiction. Recalculate quarterly, minimum.
By the way — if your purchase cycles are irregular (welcome to B2B, most of you), lean on cohort-based CLV across 3–5 year windows. And if your data's a mess? Start anyway. Deal size × renewals × retention. It's an estimate, sure. But an estimate beats a shrug every time.
Video: How to Turn Your CRM Into a War Machine Using Google Maps Data
And the deeper fix for stale numbers? Stop letting your CRM rot. Roughly 30% of CRM data goes bad every year. If you feed CLV models from records nobody's touched since 2024, no formula on earth will save you. Automating CRM enrichment with Google Maps data keeps the inputs fresh so your outputs mean something.
FAQ
What is the simplest customer lifetime value formula?
CLV = Average Purchase Value × Purchase Frequency × Customer Lifespan. That's the napkin version. A B2B client paying $5,000/year who stays 4 years? $5,000 × 1 × 4 = $20,000. Ten seconds, tops.
What's a good LTV to CAC ratio?
You want at least 3:1 — every customer returns three times what you spent to acquire them. The best companies hit 5:1. Below 1:1 you're losing money on each customer. Above 5:1 sounds dreamy but often means you're under-investing in growth, which is its own quiet problem.
How do you calculate CLV with churn rate?
First find customer lifespan: 1 ÷ churn rate. If 10% of customers leave each year, average lifespan is 10 years. Then multiply that by average annual revenue per customer. For SaaS specifically, use CLV = (Gross Margin % × ARPU) / Churn Rate — cleaner for subscription models.
Can you calculate CLV in Excel?
Yep, and it's not hard. Columns for purchase value, frequency, and lifespan. Multiply across. For SaaS, the formula is =(Gross Margin% * ARPU) / Churn Rate. I'd also add cohort tabs — group customers by the quarter they signed up and track CLV per group. Far more useful than one giant average.
What's the difference between CLV and LTV?
Honestly? Nothing. CLV, LTV, CLTV — same metric. Customer Lifetime Value versus Lifetime Value. Marketers lean CLV, finance folks lean LTV. Don't overthink it. Pick whatever your team already says and move on.
Compliance Note
Your CLV data is internal — you're crunching your own numbers, so GDPR doesn't touch that part at all. It gets relevant when you use those CLV insights to go target new prospects. Then CAN-SPAM applies: clear sender info, honest subject lines, a working unsubscribe link, your physical address in the footer. Targeting international contacts? GDPR matters. Scrap.io covers compliance in detail here if you want the legal weeds.
Time to Actually Do Something With This
Look, the CLV formula isn't complicated math. It's a way of thinking that separates companies growing on purpose from companies just reacting to whatever landed in the inbox.
McKinsey: 40% more revenue from personalization. Bain: a 5% retention bump can mean 95% more profit. 76% of B2B revenue coming from existing customers. The numbers are basically shouting at us. The teams winning right now aren't guessing which customers matter — they're calculating it and updating the model every quarter.
But the math is useless if you're chasing the wrong prospects. You need to know what ICP means in sales — the profile of the people most likely to become your highest-CLV accounts. Find those. Aim your budget there. Quit smearing it across everyone who might say yes.
Video: Scrap.io - How to Start?
If you want accurate CLV — if you want to spot high-value prospects before your competitors do, working from real-time Google Maps data instead of a stale spreadsheet — try Scrap.io free for 7 days. Your first 100 leads are included. 225,676,406 businesses, 195 countries, 4,000+ categories, and filters that work before you spend a credit. Go target the accounts actually worth your time.
Ready to generate leads from Google Maps?
Try Scrap.io for free for 7 days.