


Video: How to Scrape Google Maps at the Country Level
- What Is Market Sizing? (And Why 42% of Startups Get It Wrong)
- The TAM, SAM, SOM Framework Explained
- Top-Down vs Bottom-Up Market Sizing (Why Investors Prefer Bottom-Up)
- How to Calculate Market Size: A 5-Step Method
- Market Sizing With Real Data: A Bottom-Up Example (US Restaurants)
- 3 Market Sizing Mistakes That Kill Credibility
- Market Sizing Tools in 2026 (Reports vs Real-Time Data)
- FAQ
Here's a stat that should ruin your week if you're about to raise money. Roughly 42% of startups don't fail because the product broke. They fail because nobody wanted it at the scale the founder imagined (CB Insights). And that number barely moved: the latest 2026 post-mortems still put poor product-market fit at the top of the list, cited in 43% of shutdowns.
Market sizing is the thing that catches that mistake before it costs you two years and your savings. Do it well and you know exactly how big your opportunity is, and whether it's worth building at all. Do it with a made-up percentage on a slide, and you're gambling. This guide walks through the whole method, TAM, SAM, SOM, top-down versus bottom-up, and one example where we size a real US market with actual business counts instead of a guess. Let's go.
What Is Market Sizing? (And Why 42% of Startups Get It Wrong)
A quick market sizing definition for the impatient: market sizing is the process of estimating the total potential demand, in revenue or in number of customers, that exists in a market you've defined. That's the market sizing meaning in one sentence. Simple concept. Wildly mishandled in practice.
Here's where founders trip. They confuse a big number with a real one. The size of the market gets pulled from a Statista headline ("the wellness industry is worth $4 trillion"), a percentage gets slapped on ("we'll capture 1%"), and boom, a $40 billion opportunity appears on slide seven. It looks impressive. It's also fiction.
Investors know this game. Roughly 55% of pitch decks reviewed in 2024 lacked adequate market analysis (Waveup), and a vague market slide is one of the fastest ways to lose a room. As one founder-facing team put it bluntly:
"Founders often inflate their TAM because they think bigger is always better. A huge TAM with no clear entry point looks naïve." (via Entreprenerds)
So what does good look like? Good market sizing answers three questions in order. How big is the whole thing? How much of it can you actually serve? And how much can you realistically win in the next couple of years? That's the framework everyone uses, whether they're validating a weekend idea or doing serious startup market research before a raise. Three letters run the show: TAM, SAM, SOM.
The TAM, SAM, SOM Framework Explained
TAM is the number that gets you the meeting. SOM is the number that gets you the check. Understand the difference and you're already ahead of most decks an investor sees this quarter.
The market sizing framework everyone converges on is three concentric circles. Big circle, medium circle, small circle. Each one narrows the last. Here's what each layer actually means, and how to think about it without the MBA fog.
TAM: Total Addressable Market
Your total addressable market is the whole enchilada, every possible customer for what you sell, if geography, competition, and reality didn't exist. It's the ceiling. A useful north star, and a terrible operating number. TAM tells an investor the opportunity is big enough to matter. It tells you almost nothing about next Tuesday.
SAM: Serviceable Available Market
SAM is the slice of TAM you can actually reach, given your product, your geography, and your segment. If you sell to independent restaurants in the US, your SAM is not "global food service." It's US independent restaurants that fit your profile. This is where market segmentation with Google Maps criteria earns its keep, because your SAM is really just your TAM after you apply the filters that describe your real customer.
SOM: Serviceable Obtainable Market
SOM is the part of your SAM you can genuinely capture in one to three years, given your team, your budget, and the competitors already fighting for the same accounts. It's the honest number. And it's the one investors quietly trust the most, because as one advisory team put it:
"Investors want a massive TAM to justify the billion-dollar exit, but they invest in your SOM." (via spectup)
Airbnb's famous early market-size slide is the template people still copy: a clean TAM, SAM, SOM stack that made the opportunity feel both huge and reachable (Qubit Capital). Notice the order. Big, then believable. A serviceable obtainable market example that actually convinces someone is never the biggest number. It's the most defensible one. If you want to nail your SOM properly, it helps to first define your ICP with Google Maps data so you know exactly who you're counting.
Top-Down vs Bottom-Up Market Sizing (Why Investors Prefer Bottom-Up)
In 2014, a finance professor valued Uber at $5.9 billion. A VC on Uber's board said he'd missed by a mile. Both were doing market sizing. Very differently.
Aswath Damodaran of NYU Stern built his valuation on a top down market sizing logic: take the global taxi and limo market (about $100 billion), assume Uber tops out at 10% of it, do the math (Damodaran). Bill Gurley fired back that the whole premise was wrong, because Uber wasn't taking a slice of the old market, it was creating a new one, and his estimate came in around 25 times larger (Above the Crowd). History sided with Gurley. But here's the nuance nobody mentions: a top-down number based on the past can also be dangerously inflated. The tool isn't the problem. The assumptions are.
So let's be clear about the two methods. Top-down starts with a giant industry figure and shrinks it with percentages. Bottom-up starts from real, countable units and builds up. Here's the honest comparison:
| Dimension | 🔴 Top-Down Market Sizing | 🟢 Bottom-Up Market Sizing |
|---|---|---|
| Starting point | A big industry number | Real countable units (businesses, buyers) |
| Core move | Apply a % of a huge figure | Count units × price × frequency |
| Every assumption | Hard to defend, easy to inflate | Auditable, line by line |
| Investor read | "Where's your path to the first customer?" | "OK, I can check your math." |
| Best used for | A rough ceiling, a sanity check | The number you actually defend |
Why do investors prefer bottom-up? Because every input can be poked. As Waveup puts it, "bottom-up sizing is more credible than top-down because every assumption is defensible." A bottom up market sizing model says "here are X real businesses, each spends Y per year, here's my capture rate." You can argue with each piece. That's the point. Contrast that with "the market is $50 billion and we'll get 2%," which is unarguable precisely because it's unmoored from anything real.
My advice? Use top-down for the ceiling, then build your actual case bottom-up. And if you scroll through r/startups, you'll see the same complaint on repeat: founders inflating TAM to look impressive, then getting torched in the Q&A when someone asks how they reach customer number one.
How to Calculate Market Size: A 5-Step Method
Population, then adoption, then frequency, then price. Sounds clean, right? Here's where every founder trips, and how to not be that founder. This is how to calculate market size without hand-waving, whether you're doing market sizing for a business plan or figuring out how to size a market for a startup before you build.
The core market sizing formula is almost embarrassingly simple:
Market size = number of potential buyers × purchase frequency × average price
Everything else is just doing that honestly. Here's the 5-step version, which doubles as a repeatable answer to how to do market sizing for any business:
- Define the buyer, precisely. Not "restaurants." Independent restaurants in the US with no website, say. Vague inputs produce vague outputs. The tighter your definition, the more your number means. This is the step people skip, and then wonder why their TAM feels like fantasy.
- Count the real units. How many of those buyers actually exist, right now, in your target geography? Not an estimate. A count. This is the single biggest upgrade you can make to a market sizing model, and in 2026 you can do it in seconds (more on that in the next section).
- Set the average revenue per buyer. What does one customer pay you per year? Use conservative, explainable numbers, not your best-case pilot. If you inflate this, everything downstream inflates with it.
- Multiply for TAM, then filter for SAM. Buyers × annual revenue gives you a bottom-up TAM. Now strip it down to who you can actually serve (geography, segment, fit) and you've got your SAM.
- Apply a realistic capture rate for SOM. What share can you win in one to three years, given competitors and your budget? Be honest here. A believable 3% beats a fantasy 20% every single time.
Do this and you've built a market size analysis you can defend under questioning. Skip step two, the real count, and you're back to guessing. Which brings us to the fun part.
Market Sizing With Real Data: A Bottom-Up Example (US Restaurants)
You don't have to guess how many restaurants are in the US. You can count them. Today. In two clicks.
Let's build an actual bottom-up TAM example. Say you run a web agency that builds websites for restaurants, and you want to size the US opportunity. Every number below is live Google Maps data pulled from Scrap.io in September 2026, and you can reproduce it in a minute.
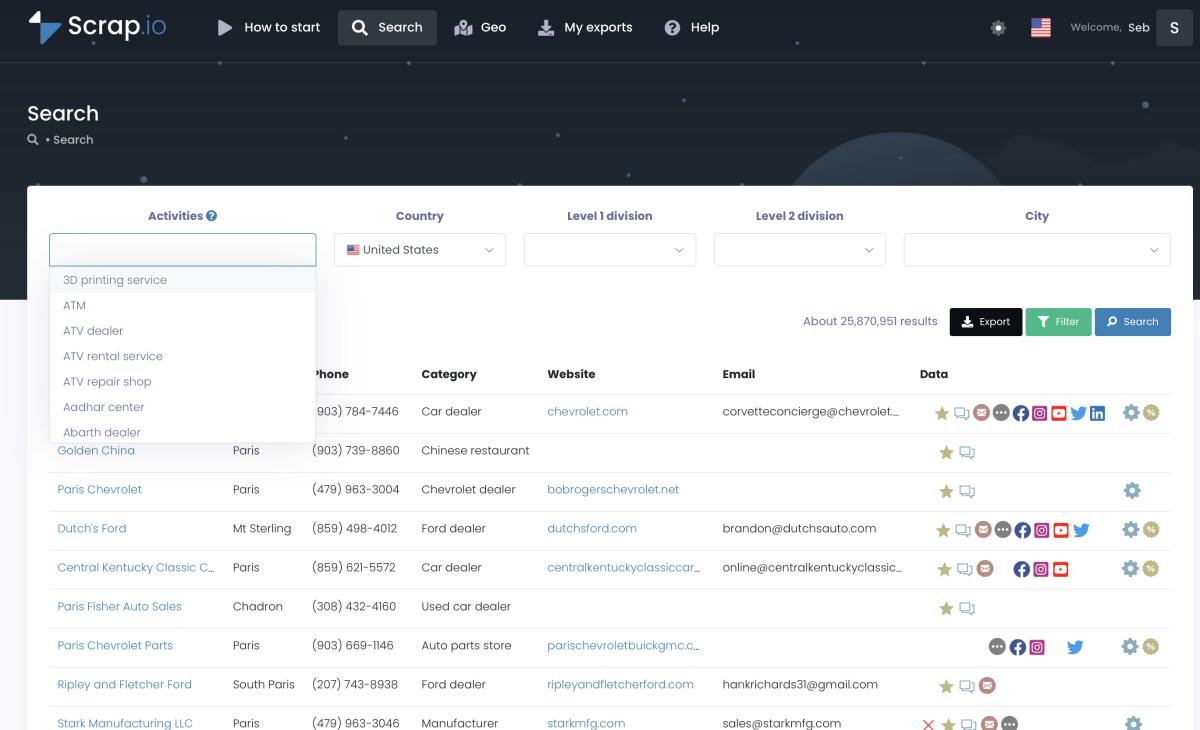
TAM proxy. Pick "restaurants" from the full list of 4,000+ Google Maps categories, set the country to the US, and you get your ceiling: there are 670,594 restaurants in the United States on Google Maps right now (Scrap.io, Sept 2026). That's not a Statista headline. That's a count of real, listed businesses. Multiply that by whatever a restaurant pays for a website build per year and you've got a bottom-up revenue TAM anchored to reality.
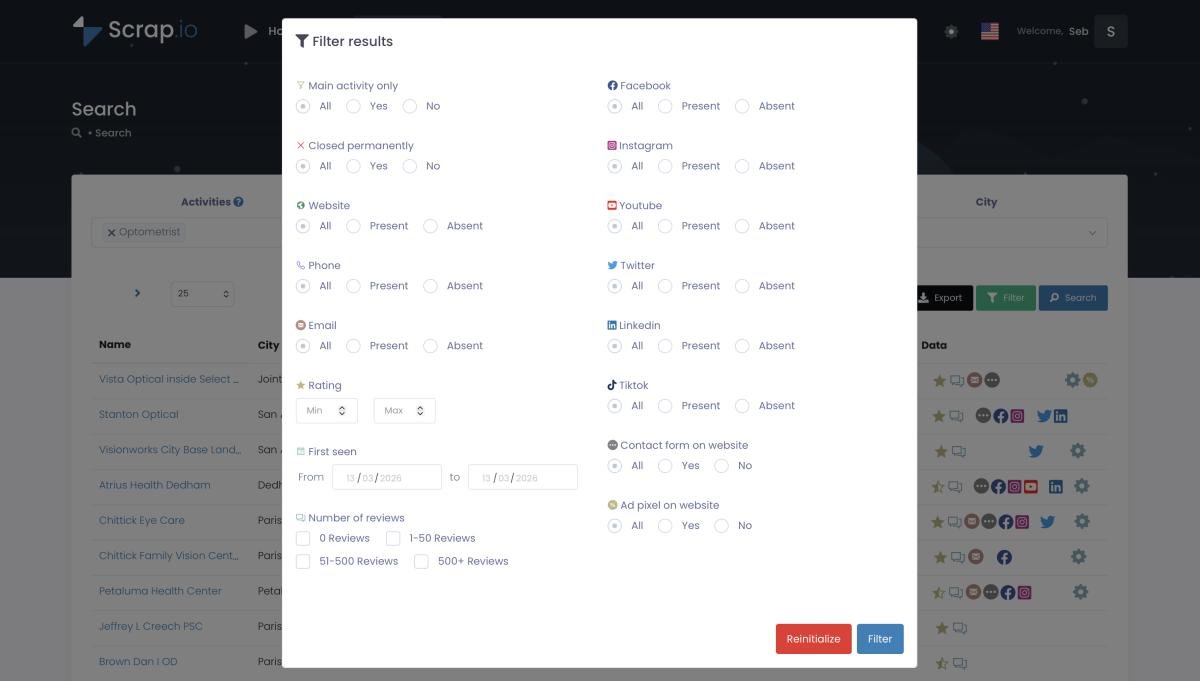
SAM. Here's where it gets sharp. Your product is for restaurants without a website. Filter for that, and the number drops to 223,662 US restaurants with no website at all, roughly 33% of the market (Scrap.io, Sept 2026). That's your serviceable available market, and you counted it before spending a single credit. Want to actually reach them? Around 200,701 restaurants (about 30%) list at least one email on their site, which is your reachable, contactable subset. The filters run before extraction, so sizing your SAM costs you nothing.
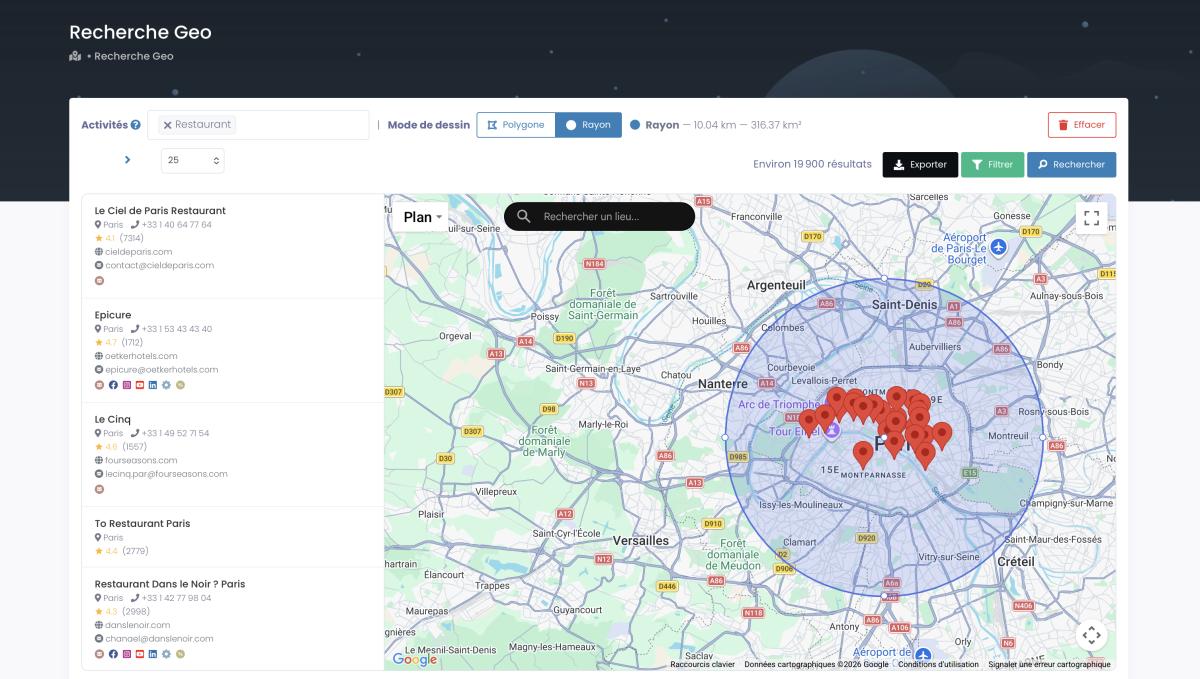
SOM. Nobody wins a whole country in year one. So zoom in. Use GeoSearch to draw a radius around your city, or a custom polygon over the exact zone you serve, and count only the no-website restaurants inside it. Multiply that by a realistic conversion rate and your annual price, and you've got a serviceable obtainable market you could actually deliver on. Real number, real geography, real path to a first customer.
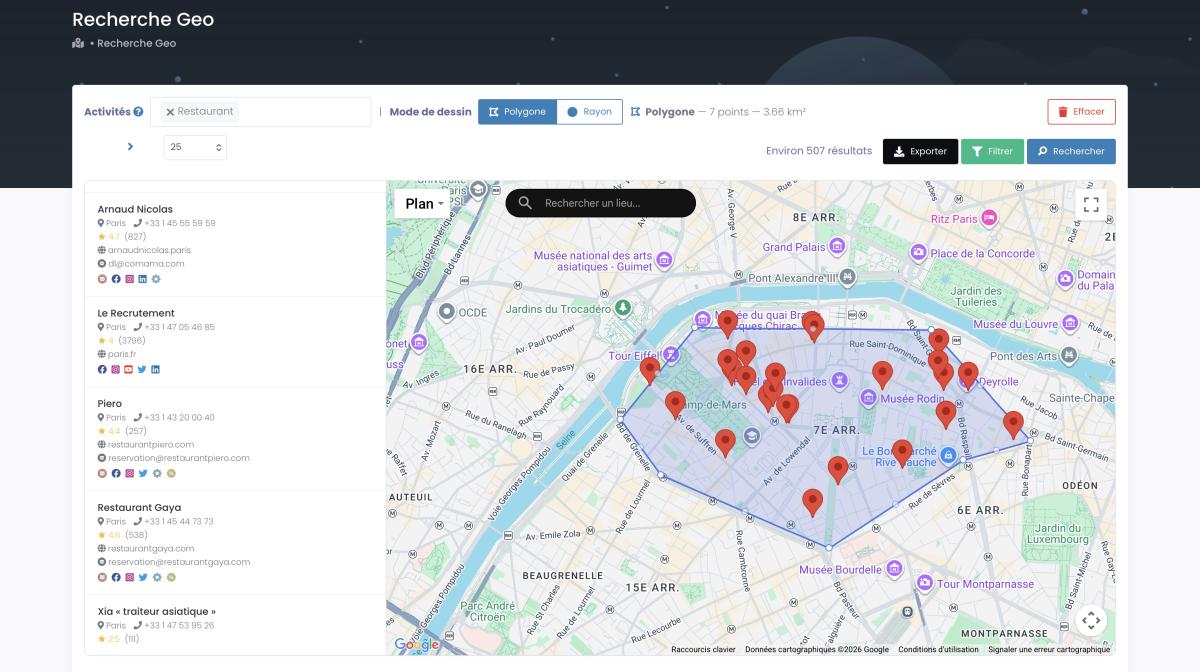
Need a shape that isn't a circle? Draw a polygon around one neighborhood and leave the suburbs out. Same method, tighter zone.
See the difference from a top-down guess? Every layer here is a filtered count, not a percentage of a headline. And the whole thing scales, from one city to an entire country. This video shows the country-level version in action, so you can size a national market the same way:
Video: How to Extract Every Business in 1 Click (No Category)
One honest caveat. A business count is a proxy, not a revenue figure on its own. But that's the whole strength of bottom-up: you turn the count into revenue by multiplying real potential customers by an average annual spend, and every step is defensible. Try building that from a $5,000 industry report. You can't, because the report won't let you filter to the 223,662 that actually match, and it won't hand you the list either.
3 Market Sizing Mistakes That Kill Credibility
If your market slide says "$50B TAM" with no path to a first customer, an investor already stopped reading. Here are the three mistakes that do the most damage, and how to dodge them.
Mistake 1: leading with a TAM you can't reach. A giant top-down number with no entry point doesn't signal ambition. It signals that you haven't thought about execution. Remember, "no market need" is the single most-cited cause of startup death, tied to that stubborn 42% figure from CB Insights. A big TAM doesn't protect you from it. A defensible SOM does.
Mistake 2: mixing top-down and bottom-up on the same slide. Pick one method and commit. Combining a top-down category number with bottom-up user math on the same chart confuses investors and quietly wrecks your credibility. Choose the defensible one (bottom-up), and use top-down only as a separate sanity check.
Mistake 3: sizing once and never updating. Markets move. A number you calculated from a 2024 report is describing a market that no longer exists. Businesses open, close, and relocate constantly, which is exactly why funds discount stale, inflated top-down TAMs and reward founders whose SOM is built on fresh, current data. If your market size can't be re-run this month, it's already decaying.
Notice the through-line. Each mistake is really the same mistake wearing a different hat: preferring a big number over a true one. Flip that instinct and your market sizing goes from "nice story" to "I can verify this."
Market Sizing Tools in 2026 (Reports vs Real-Time Data)
A $5,000 industry report tells you what the market was last year. Real-time data tells you what it is right now. In 2026, that gap is the whole game.
The old toolkit for market sizing was a stack of static reports: Statista, Gartner, IBISWorld, a McKinsey deck if you had the budget. Useful for a big-picture ceiling. Useless the moment you need to know how many businesses actually match your profile in a specific place, today. They're aggregated, dated, and you can't filter them. You certainly can't turn them into action.
The new toolkit is real-time business data. Instead of buying a frozen snapshot, you count the live market yourself. The best market research tools for local businesses now let you query the actual population of a market, filter it down to your exact customer, and export the list, all in the same session. That's a different category of tool than a PDF.
This is where Scrap.io fits. It counts every business of a type in a city, region, or entire country straight from Google Maps data, for free, then lets you filter by website presence, email, rating, category, and more before you extract anything. Three things make it genuinely useful for market sizing. Counting is free (0 credits), so sizing a market costs nothing. Filters apply before extraction, so your SAM is a surgical count, not a rough guess. And the data is pulled fresh in real time, so you're never sizing a market off last year's numbers. It's location intelligence pointed straight at the market-sizing problem.
Best part? The counting itself never costs a credit, which means the exact task most founders overpay for, figuring out how many buyers exist, is the one thing you get for nothing.
FAQ
What is market sizing?
Market sizing is the process of estimating the total potential demand, in revenue or number of customers, available in a defined market. It's usually done with the TAM, SAM and SOM framework, which moves from the whole market down to the share you can realistically capture.
How do you calculate TAM, SAM and SOM?
TAM = all potential customers × average annual revenue. SAM = the slice you can realistically serve, filtered by geography, segment, and fit. SOM = the share you can capture in one to three years. Bottom-up (real counts) beats top-down (percentages of a big number) because every assumption stays defensible.
What is the difference between top-down and bottom-up market sizing?
Top-down filters a big industry figure with percentages ("2% of a $50B market"). Bottom-up builds from real countable units ("223,662 businesses × average annual spend"). Investors prefer bottom-up because each input can be checked, so the final number is far harder to inflate.
Is market sizing the same as a consulting case-interview question?
Related, but different. A case interview ("how many golf balls fit in a plane?") tests mental estimation under pressure with rough assumptions. Business market sizing uses real data to guide strategy and fundraising. Same instinct, higher stakes, and in the real world you should count instead of guess whenever you can.
How can I size a market with real data instead of guessing?
Count the actual businesses in your category and geography rather than applying a percentage to an industry report. Scrap.io counts every business of a type in a city, region, or country from Google Maps data, for free, then lets you filter by no website, has email, or minimum rating. That turns your SAM into a real number and hands you the prospect list to act on.
Stop Guessing Your TAM. Start Counting It.
Market sizing isn't about producing the biggest number on the slide. It's about producing the truest one. TAM gets you the meeting, SAM shows you're grounded, and SOM, the honest number, is what actually earns trust. Build all three bottom-up, from real counts, and you've got a market sizing model that survives the hard questions instead of collapsing under them.
The founders who win in 2026 aren't the ones with the flashiest $50B TAM. They're the ones who can show an investor a filtered count of real businesses and say, "here's exactly how many customers exist, where they are, and how we reach the first one." That's the whole difference. And it starts by turning your market into a real, countable list instead of a guess. Here's how to turn your market into local business leads once you've sized it.
Generate a list of restaurant with Scrap.io